Build healthier futures with data-powered public health
Leverage the most powerful community data platform to explore, uncover, and share insights that can help you transform public health.


How is mySidewalk Designed for Public Health?
At mySidewalk, our mission is deeply intertwined with the goals of public health—promoting health equity, improving population health, and ensuring every community has the resources to thrive. Public health professionals are the changemakers on the frontlines, confronting complex issues that affect the well-being of millions. Whether you're a local, regional, or state office, we've built our library and platform of tools with health departments of all shapes and sizes in mind. We understand the challenges you face: the need for timely, accurate data to drive decisions, the pressure to modernize data systems, and the constant demand for innovation to meet evolving health priorities.
Our platform is designed to align seamlessly with public health initiatives, offering powerful tools to modernize and streamline data management. With mySidewalk, you’re not just gathering data; you’re transforming it into actionable insights that can shape healthier communities.
Whether you're addressing chronic disease, health equity, or emergency preparedness, mySidewalk empowers you with the data and innovative tools you need to lead your community toward better health outcomes. By leveraging the power of AI, our platform enhances your ability to analyze public health trends, uncover health inequities, and craft data-driven reports and interventions with precision.
Explore More About mySidewalk for Health
What is Public Health Data?
Get the Details on Our Data
In public health, access to comprehensive and reliable data is essential. However, to truly understand community health, you need more than just surface-level statistics—you need the ability to explore the intricate web of factors that influence health outcomes. That’s where mySidewalk excels.
Our data library has grown to include over 5 billion up-to-date community data points from more than 50 trusted sources, and it continues to expand. Every subscription provides access to a vast array of critical public health datasets, covering everything from disease prevalence and healthcare access to social determinants of health. But what sets our platform apart is the breadth of data available across a wide range of topics that are inherently connected to public health. Whether it’s transportation, education, housing, economic development, or even environmental factors, our data library gives you the ability to explore the myriad ways these elements intersect and influence health outcomes.
Getting better answers with a more holistic perspective
Having access to diverse data sources is crucial for a holistic view of the factors influencing health outcomes. For instance, how do education levels correlate with chronic disease rates? What role does access to public transportation play in addressing health disparities? By exploring these connections, you can uncover patterns and trends that lead to more effective and targeted public health interventions.
We empower public health professionals—from data novices to experts—to delve deep into the community data, identify health inequities, and develop data-driven strategies that address the root causes of health disparities. Our platform is designed to make intersectional analysis accessible and actionable, helping you make informed decisions that positively impact population health.
By leveraging our comprehensive data library, you can move beyond traditional health metrics and explore the broader context in which health outcomes occur. Whether you're conducting a Community Health Assessment (CHA), developing a health equity initiative, or responding to emerging public health threats, we are here to help provide the data and insights needed to drive meaningful change in public health.
The most relevant data to public health—and everything else
Support intersectional analysis with more than 8,000 topics and datasets from more than 50 trusted sources—all in one place.
mySidewalk's Public Health Templates
One of the worst feelings is staring at a blank page, especially when you’re up against tight deadlines and the urgent need to communicate critical public health insights. That’s where our templates come in.
Traditional processes for developing a Community Health Assessment (CHA) or a Community Health Improvement Plan (CHIP) can be time-consuming, often taking months to complete. But with expertly designed Report and Dashboard templates, you can significantly speed up this process without sacrificing quality or depth.
Our templates are tailored specifically for public health professionals, offering a streamlined way to gather the most relevant data aligned with industry standards. These templates come pre-populated with key datasets and ready-made visualizations, so you can focus on analysis and decision-making rather than starting from scratch. Our platform makes it easy to customize these templates to fit your community’s unique needs in just a few clicks, ensuring that your reports are both comprehensive and specific to your goals.
By leveraging templates, you can ensure that your public health reports are not only data-rich but also visually engaging and easy to understand. Imagine a future where you can uncover and deliver insights more quickly and enable your team to move from analysis to action faster than ever before.
You’re not just saving time—you’re enhancing your ability to communicate the full picture of your community’s health, driving more effective public health strategies and interventions.
Public Health Templates
Walk a smarter path to accreditation
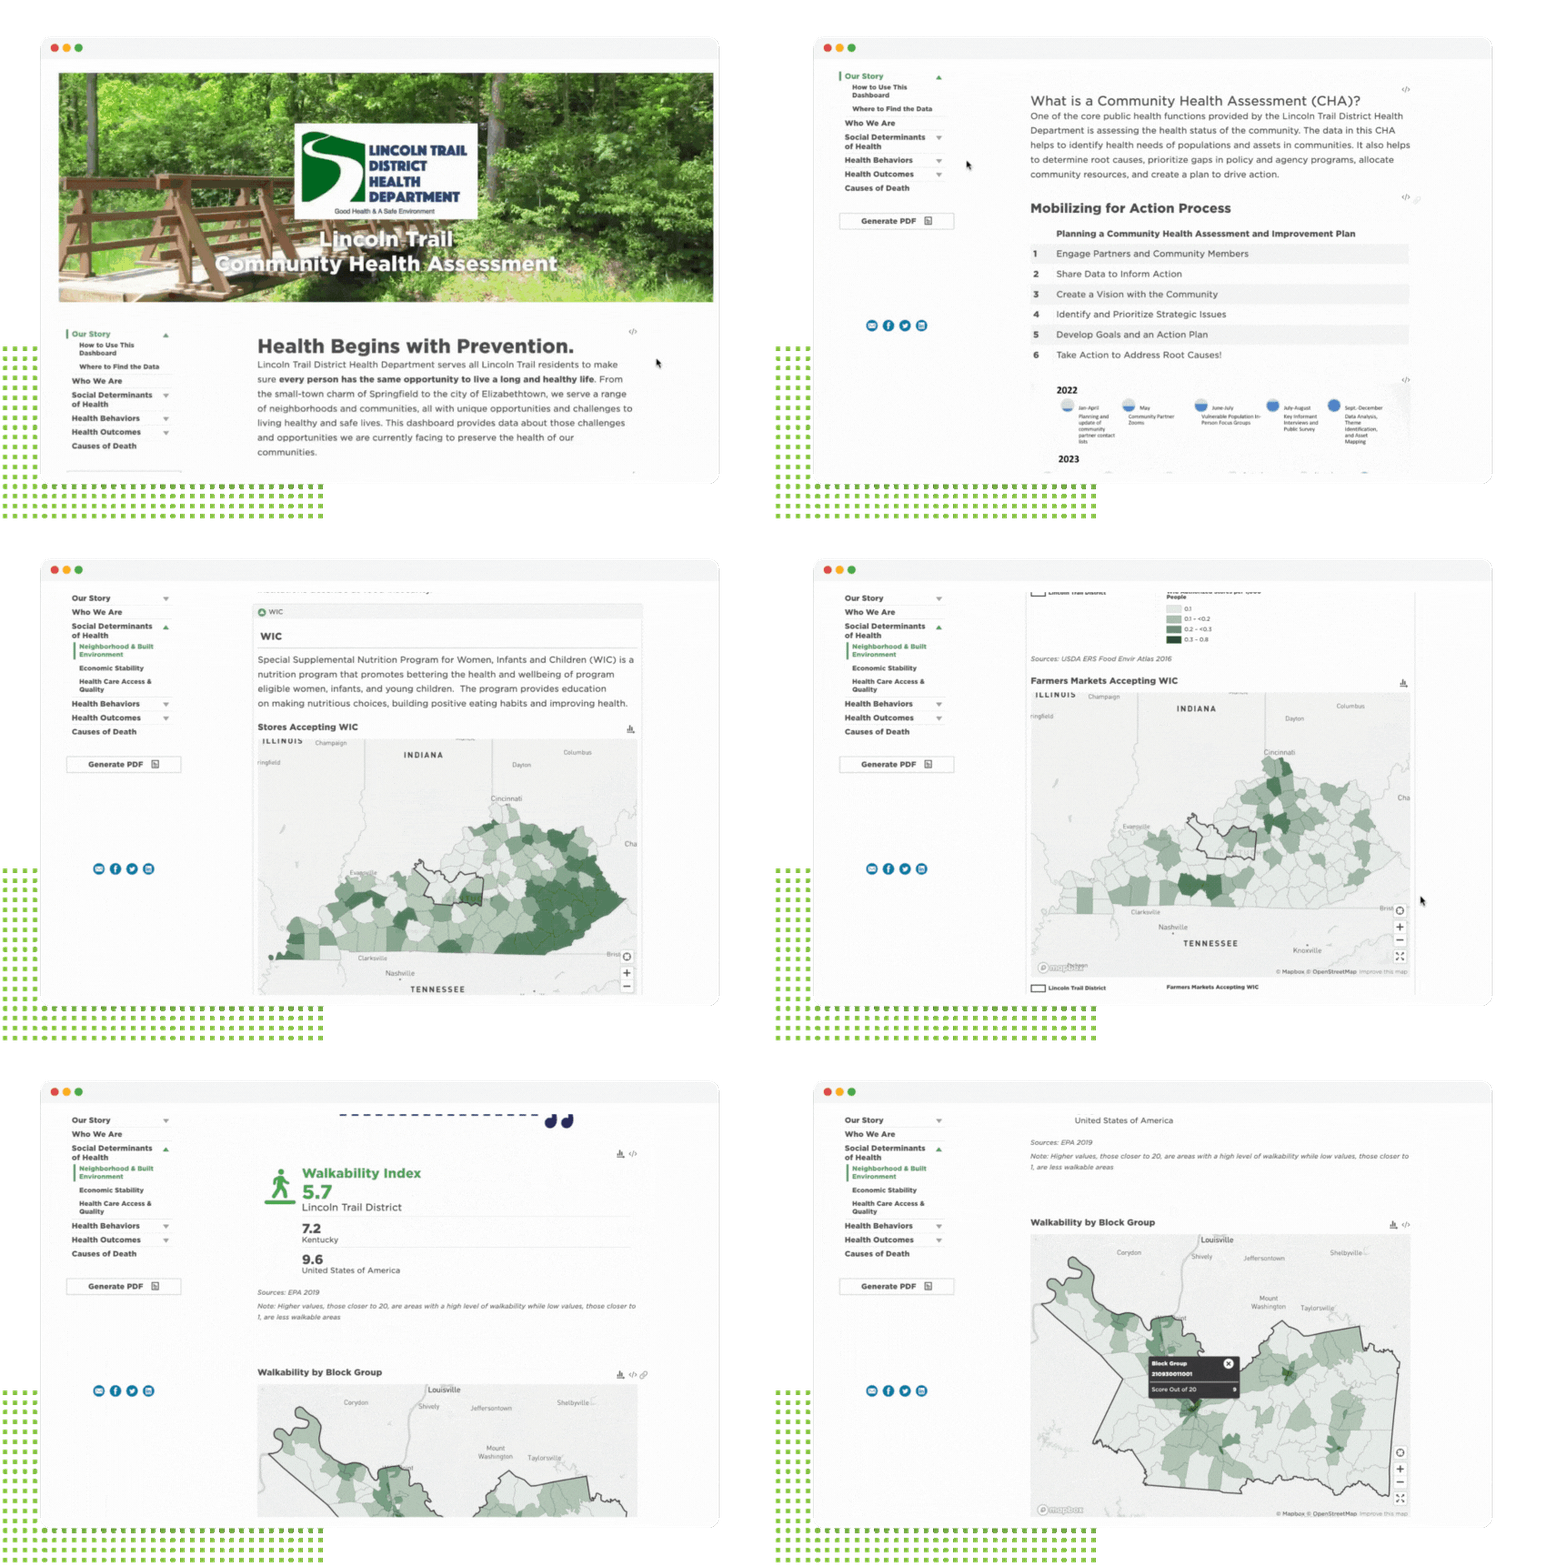
From Community Health Assessments to Improvement Plans, we can make every step of the reporting process easy with templates designed by public health professionals like you. Dynamic, engaging, interactive, and always up to date, our CHA, CHIP and Substance Use Disorder templates gather the most important datasets and indicators based on accreditation requirements and .

Explore more than 8,000 topics
Beyond CHAs and CHIPs, we offer a variety of other public health-focused Dashboards, including one for Substance Use Disorder, and Reports like Health Equity and Social Determinants of Health (SDOH).
Even our exploratory tools give you shortcuts to finding the right data you're looking for. Data Guides include everything from Community Profiles to Maternal & Child Health. Each is designed to help you tell a compelling story with your data, complete with narrative sections that you can adapt or expand to highlight your findings and recommendations.
We are lucky to work with the kinds of organizations we do. Local and state health departments from around the country have been using our community data library and tools for more than a decade to guide—and get the word out—about their work. In fact, their feedback has been applied directly back into our data source selection, our platform, and templates.
It's no secret finding funding and support for programs and initiatives require data. While many communities face issues like substance use disorders, maternal and child health, and food insecurity, knowing which neighborhoods—and which neighbors—experience negative impacts the most can help you advocate for and allocate resources to those who need them most.
Get Inspired

The data assistant for public health
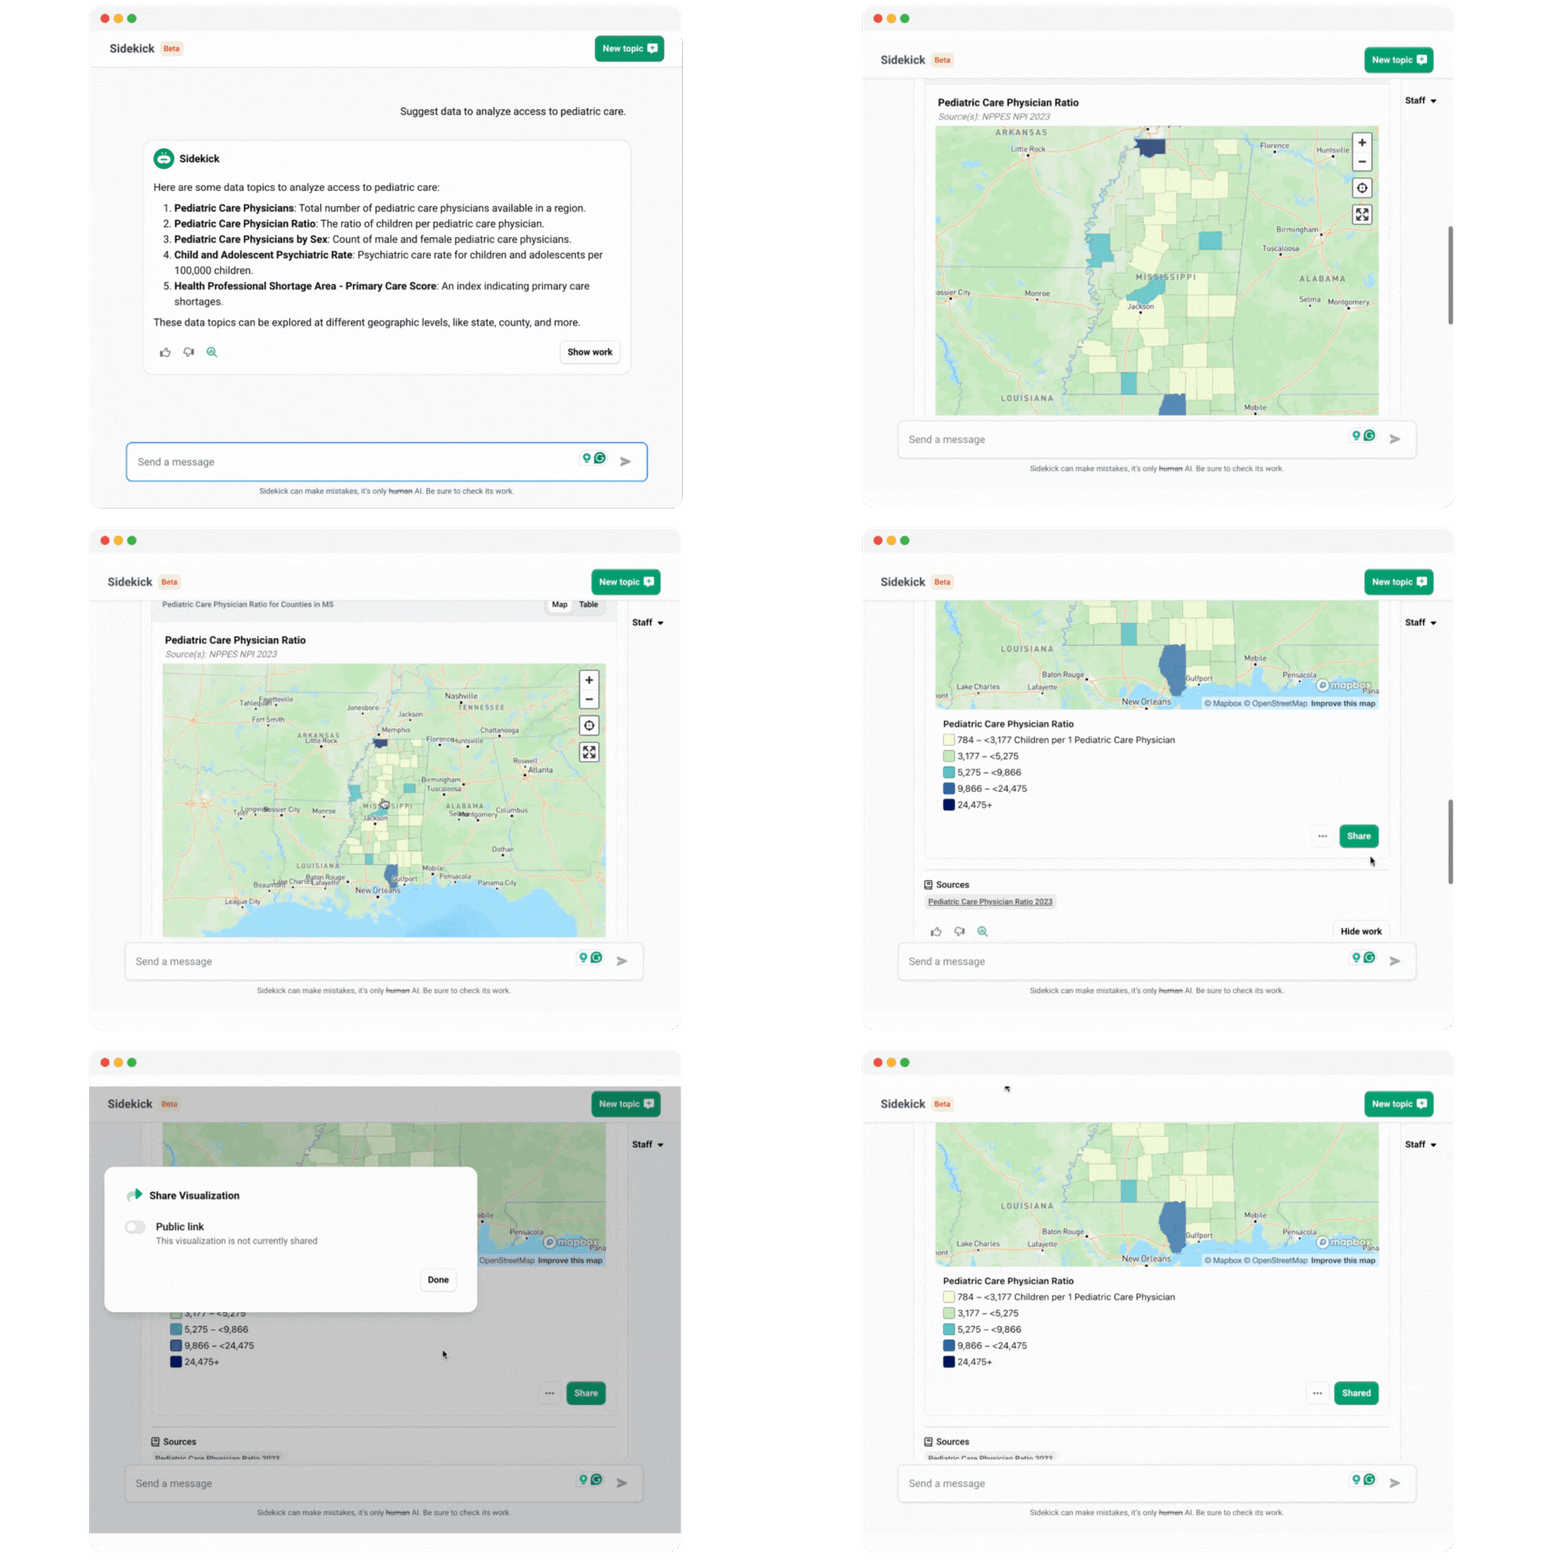
Sidekick helps you explore our robust community data library, build visualizations like maps, and get answers about places, health, and so much more.

Apply for and allocate mission-critical resources
Getting more up-to-date, more precise data, faster is only the start of how our tools make critical, time-consuming work like grant applications easier for teams.
AI-powered tools like Sidekick and CoWrite help you write narratives, drafts of visualization analyses, and tailor language for any audience.
Two Rivers Public Health used our lead data to secure a $1.3 million HUD Lead Hazard Reduction Grant, becoming one of the first rural health departments to receive this funding. This grant enables them to train contractors, identify high-risk homes, and carry out essential lead abatement work. By combining data on older homes and child populations, Two Rivers ensures their efforts are focused on where they will make the most significant impact, creating safer homes for their Nebraska communities.
Built by Data & Industry Experts
Trusted by Public Health Professionals
Beautiful & Interactive Visualizations
Designed to be Shared
8,000+ Community Topics in One Place
Innovative Technology at Your Fingertips
Explore and share community data like an expert.
With mySidewalk, public health professionals of all kinds can explore and share community data like an expert.
From Our Blog
.png?width=878&height=584&name=Solving%20the%20Data%20Capacity%20Crisis%20Email%20Banner%20(4).png)
The Data Capacity Crisis Explained: A Q&A with Stephen Hardy

The Data Capacity Crisis


