KABOOM-bw-logo
Childcare, Environmental Justice, Planning

Safe play for every child

Read how KABOOM! uses place-based equity mapping to eradicate playspace inequity across America.

highest number of parks located in a single state (California)

lowest number of parks located in a single state (North Dakota)

%

lowest percentage of parks covering a single state (Mississippi)

%

highest percentage of parks covering a single state (Alaska)

Untitled design (3)

The Challenge

On a bold mission to eliminate playspace inequity, KABOOM! needed to understand where children and families were most negatively impacted by a lack of resources – and lack of places to play. children and families. 

KABOOM! had the partnerships, the buy-in, and the funding to support a bold objective: end playspace inequity in 25 communities in 5 years. In fact, they even had working relationships with individuals at city agencies, nonprofits, schools and community partners across America. However, something was missing: a reliable, data-backed way to understand a community’s need for playspaces. Without a national data set to accurately map playgrounds and playspaces, KABOOM! knew that determining playspace access and equity in a community is extremely difficult. Although some data sets like Google Maps and OpenStreetMap Foundation provide national coverage, they aren’t always accurate.

It requires, per community, hundreds of hours per place to clean up that data to understand where the actual playground locations are."
Colleen Coyne

Learning & Evaluation Specialist, KABOOM!

“Given the breadth of KABOOM!’s work spanning the entire nation, we wanted a really reliable and data-backed way to understand whether or not a community is likely to have playspaces, which was part of the genesis for us starting to talk with mySidewalk about a custom index and thinking critically about what different data indicators were likely good predictors of place-based inequity,” she continues.

By late fall of 2021, KABOOM! had been exploring the possibility of cross-country, place-based equity mapping for about one year. Colleen says that the COVID-19 pandemic acted as a “catalyst for us to think deeply about, when we get through this pandemic, how do we ensure we don’t go through another long stretch of time without more kids having access to places to play?"

Untitled design (3)

The Solution

Previously, KABOOM! estimated playspace inequity in a community using three indicators: the child dependency ratio, the percentage of Black, Indigenous and People of Color (BIPOC) individuals, and median household income. However, KABOOM! felt that this initial method provided an incomplete picture of playspace inequity among communities. 

In response, KABOOM! partnered with mySidewalk to create the Playspace Inequity Prioritization Index (PIPI). This custom index culls 21 publicly available data sources and creates a score for each census tract in the United States. Using a standard z-score, each value is given a positive or negative deviation from the mean (zero). A higher score indicates a perceived higher value of playspace inequity.

“We felt much more confident in PIPI because there were 21 indicators rolled into that. It told stories and identified areas that we wouldn’t have seen beforehand because we weren’t necessarily mapping the entire United States or every census tract in the U.S. in the old way,” says Isaac Castillo, Senior Advisor, Learning & Evaluation at KABOOM!

“I think PIPI has been a catalytic tool for getting people internally at KABOOM! excited about data,” says Colleen. “It’s the first time people are actively coming to us with requests to see data, to learn more about how we’re using it. Folks on our senior team are excited about it, our board’s excited about it.”

About KABOOM!

KABOOM! is a national nonprofit with an ambitious goal: to end playspace inequity in 25 places in 5 years. 

Visit their website →

The Outcomes

19
Save Time Wrangling Data
No longer spending hundreds of hours cleaning data to locate playgrounds in a community
8-1
Become a Source of Truth
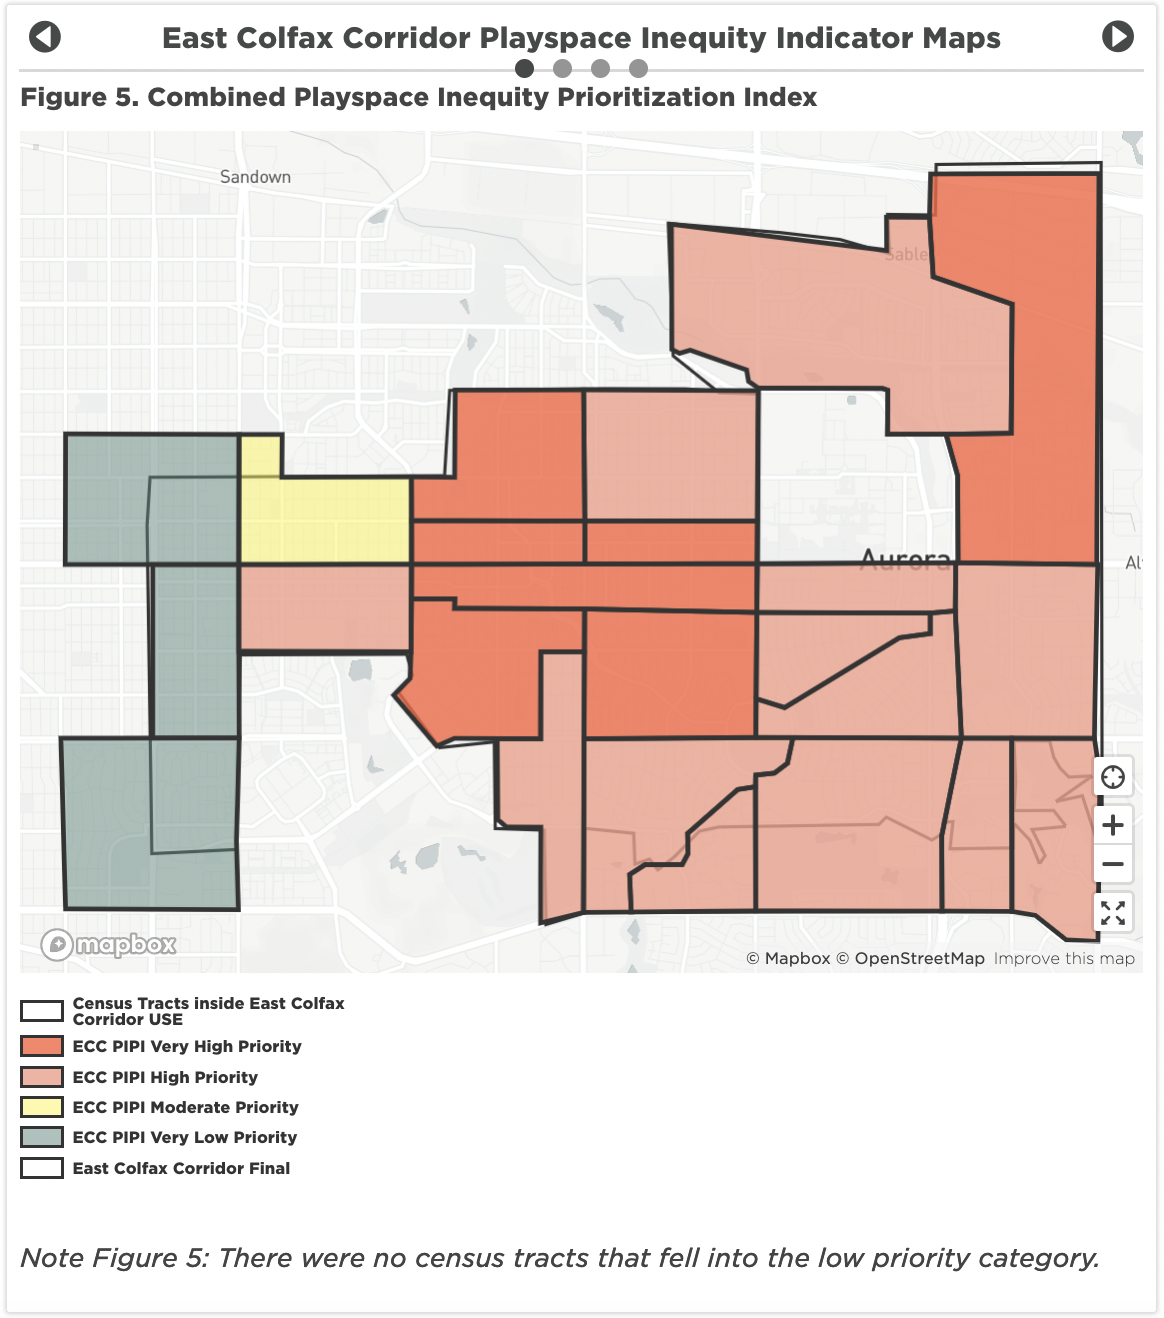
Using data mapping tools to uncover playspace inequity in areas of greatest need
5-1
Find Better Insights
Understanding the quality of playspace in Otero County, Rio Grande County and East Colfax Corridor in Colorado
7-1
Build Capacity to Use Data
Employees, senior leadership and board members actively requesting data to make decisions
10-1
Inform Stakeholders
Sharing the impacts of playspace inequity with federal agencies at the White House

Using data mapping to eliminate playspace inequity

Prior to 2020, Colleen says that when the organization looked at data, the focus was on where new playgrounds were being built. Over the last couple of years, that mindset has shifted to a data-centered approach. 

“It’s one thing to talk about these issues in the abstract,” Isaac says. “It’s quite another to quickly create some maps and show people where the [playspace inequity] is happening.” 

When KABOOM! does a playspace equity demonstration with a potential community partner, Isaac says they sometimes ask individuals where they grew up and create a map to see if it tracks with their understanding of a particular place. The data visualizations often resonate with an individual’s lived experience. 

“It creates another level of credibility for KABOOM!, but it also creates that level of connection with the individual because they can see it,” Isaac says. “To bring up mySidewalk, show them the maps, create them in real time,  and then you see the light bulb come on. You see the smiles.”

Thanks to PIPI, KABOOM! is using the power of data mapping and visualization tools to connect with communities nationwide and eliminate playspace inequity more quickly. As part of its “25 in 5 Initative to End Playspace Inequity,” KABOOM! is working on playspace projects nationwide, including: Atlanta Public Schools, Baltimore City Public Schools, Baltimore Recreation and Parks, and the City of San Francisco.

It's only within these last couple of years that we started to build a data culture internally. And PIPI, and mySidewalk by extension, has been an absolutely fundamental tool in moving that work forward.
Colleen Coyne

Learning & Evaluation Specialist, KABOOM!

Assessing current playspaces in Colorado communities

Recently, KABOOM! wrapped up a playspace equity project for the state of Colorado. Using census tracts, KABOOM! and its partners mapped playspace and assessed the quality of playspaces in three regions: East Colfax Corridor, Otero County and Rio Grande County. Using an average playspace quality scale of 1 to 4, each region’s playspaces received a score. Both the count of playspaces and the count of accessible playspaces were rubric for the average quality score. 

Rio Grande County received the lowest score, at 1.87, while East Colfax Corridor attained the highest score at 2.14. It’s also notable that East Colfax Corridor has the most playspaces (229) while Otero County has a meager 36 playspaces. 

These findings supported KABOOM’s recommendation for the prioritization of future playspace interventions in each county to create more equitable spaces for kids (and adults) to play.

Nationally recognizing the importance of data and PIPI

In the spring of 2023, KABOOM!’s CEO Lisa Ratliff went to Washington, D.C., to be a part of the White House Challenge to End Hunger and Build Healthy Communities campaign, a new initiative under the Biden administration. 

During the visit, Ratliff was able to speak to KABOOM’s work with mySidewalk to create its custom playspace inequity prioritization index. When the Centers for Disease Control and Prevention (CDC) Foundation learned about PIPI, they requested a meeting to further discuss it. 

“Those individuals heard about the work we were doing, heard about PIPI specifically, and asked us to sit down with them for an hour and explain how we were using PIPI and what went into it and the data, for the CDC to better understand how we’re approximating playspace inequity,” Isaac says. 

Although the CDC Foundation believes that data should be created and constructed for use in public health initiatives, Isaac says the foundation is realizing that few nonprofit organizations use data in a sophisticated way.

“They were very excited about how we were using PIPI and how we were using it for decision-making going forward,” Isaac says.

We were asked to partner with the White House and some of the federal agencies on the work that President Biden is doing with health, public health and community health.
Isaac Castillo

Senior Advisor of Learning & Evaluation, KABOOM!

The Future

Moving data mapping and playspace equity forward

As of today, PIPI and its maps are only for KABOOM!’s internal use. However, Isaac says the organization is exploring ways to make the index available to the public. 

“We’re exploring ways to get the funding to do a Press Generator so that anyone can build their own PIPI maps going forward,” he says. “Everyone that we have talked to and showed the PIPI and PIPI maps to are super excited about it and want to learn more and want to play with it on their own.” 

The other big question that KABOOM is asking, Isaac says, is, what will PIPI 2.0 look like? There’s talk of looking at data changes over time. Another option is to “layer other types of maps and other types of data to help us prioritize even further where we can do some work, particularly work that is complementary to other issues,” Isaac says. 

For example, Houston has a lot of high-risk flood areas. The Environmental Protection Agency (EPA) has maps for those.

“If we can stack PIPI data with high-risk flood zone data areas and identify communities that are high-need on both, and then work with the local community to build playgrounds that have drainage components built into the playground, you solve two problems,” Isaac says. “We're thinking about other types of data we can layer onto PIPI to help us identify communities that have multiple needs and design playgrounds that will satisfy those needs.”