

Starting today, you can create a custom boundary directly in mySidewalk using our Drawing Tool feature.
When we asked our customers what more they want from mySidewalk, they said that they wanted to be able to draw their own boundaries on a map. We took that feedback and created a drawing feature that lets you draw polygons, radiuses, lines, and boxes.
You can also combine census tracts, neighborhoods, zip codes, and any other census geographies for an area of interest. Once created, these custom boundaries are available to use in Location Snapshots, Templates, and within the mapping mode. Even if your shape spans multiple census tracts, with Location Snapshot, our platform will instantly apportion data to your custom geographic area so that you can quickly get the information you need.
Each of our 5 Drawing Tools can serve a variety of purposes for a variety of roles. For John Yurick, senior project manager at McMahon Associates, Inc., an engineering & planning firm, the new drawing tools offer him more project flexibility, as well as more independence when it comes to GIS.
“Having the ease and flexibility of defining our study area is important, and will allow us to customize it for our projects,” he said.
Not everyone has GIS software or a GIS background, but with the drawing capability we can still jump into mySidewalk and start looking at projects on our own without having to rely on our GIS staff.
Below are the 5 different drawing options you now have in the mySidewalk tool (For a step-by-step guide on how to use the drawing tools, check out the Help Desk article here).
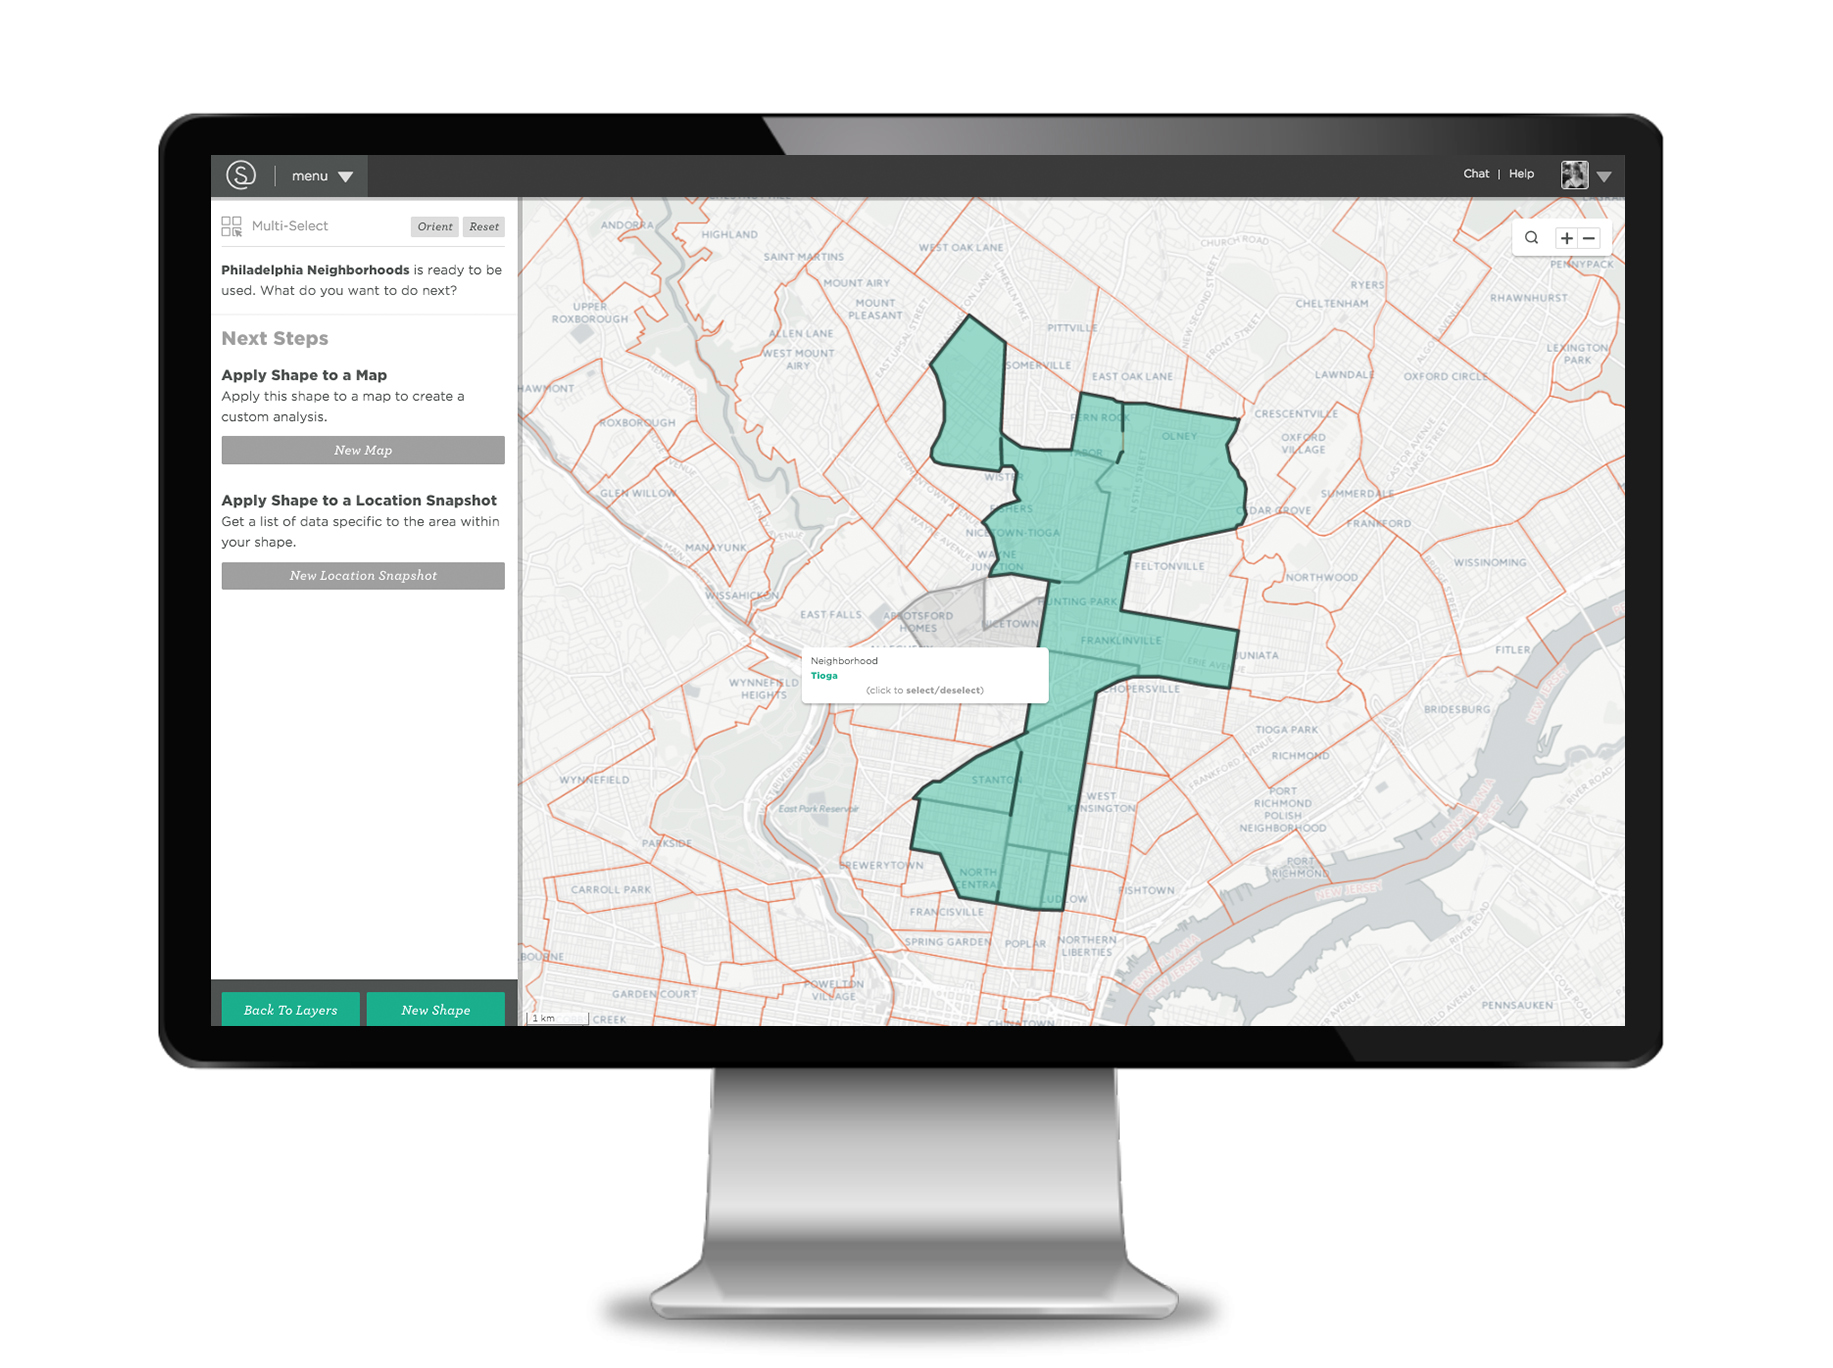
Multi-Select
The Multi-Select tool can be used when you want to combine multiple geographies for a single comparison. For example, you can combine several neighborhoods that make up a special improvement zone, combine census tracts that make up a downtown area, or select multiple counties that make up a regional council of governments.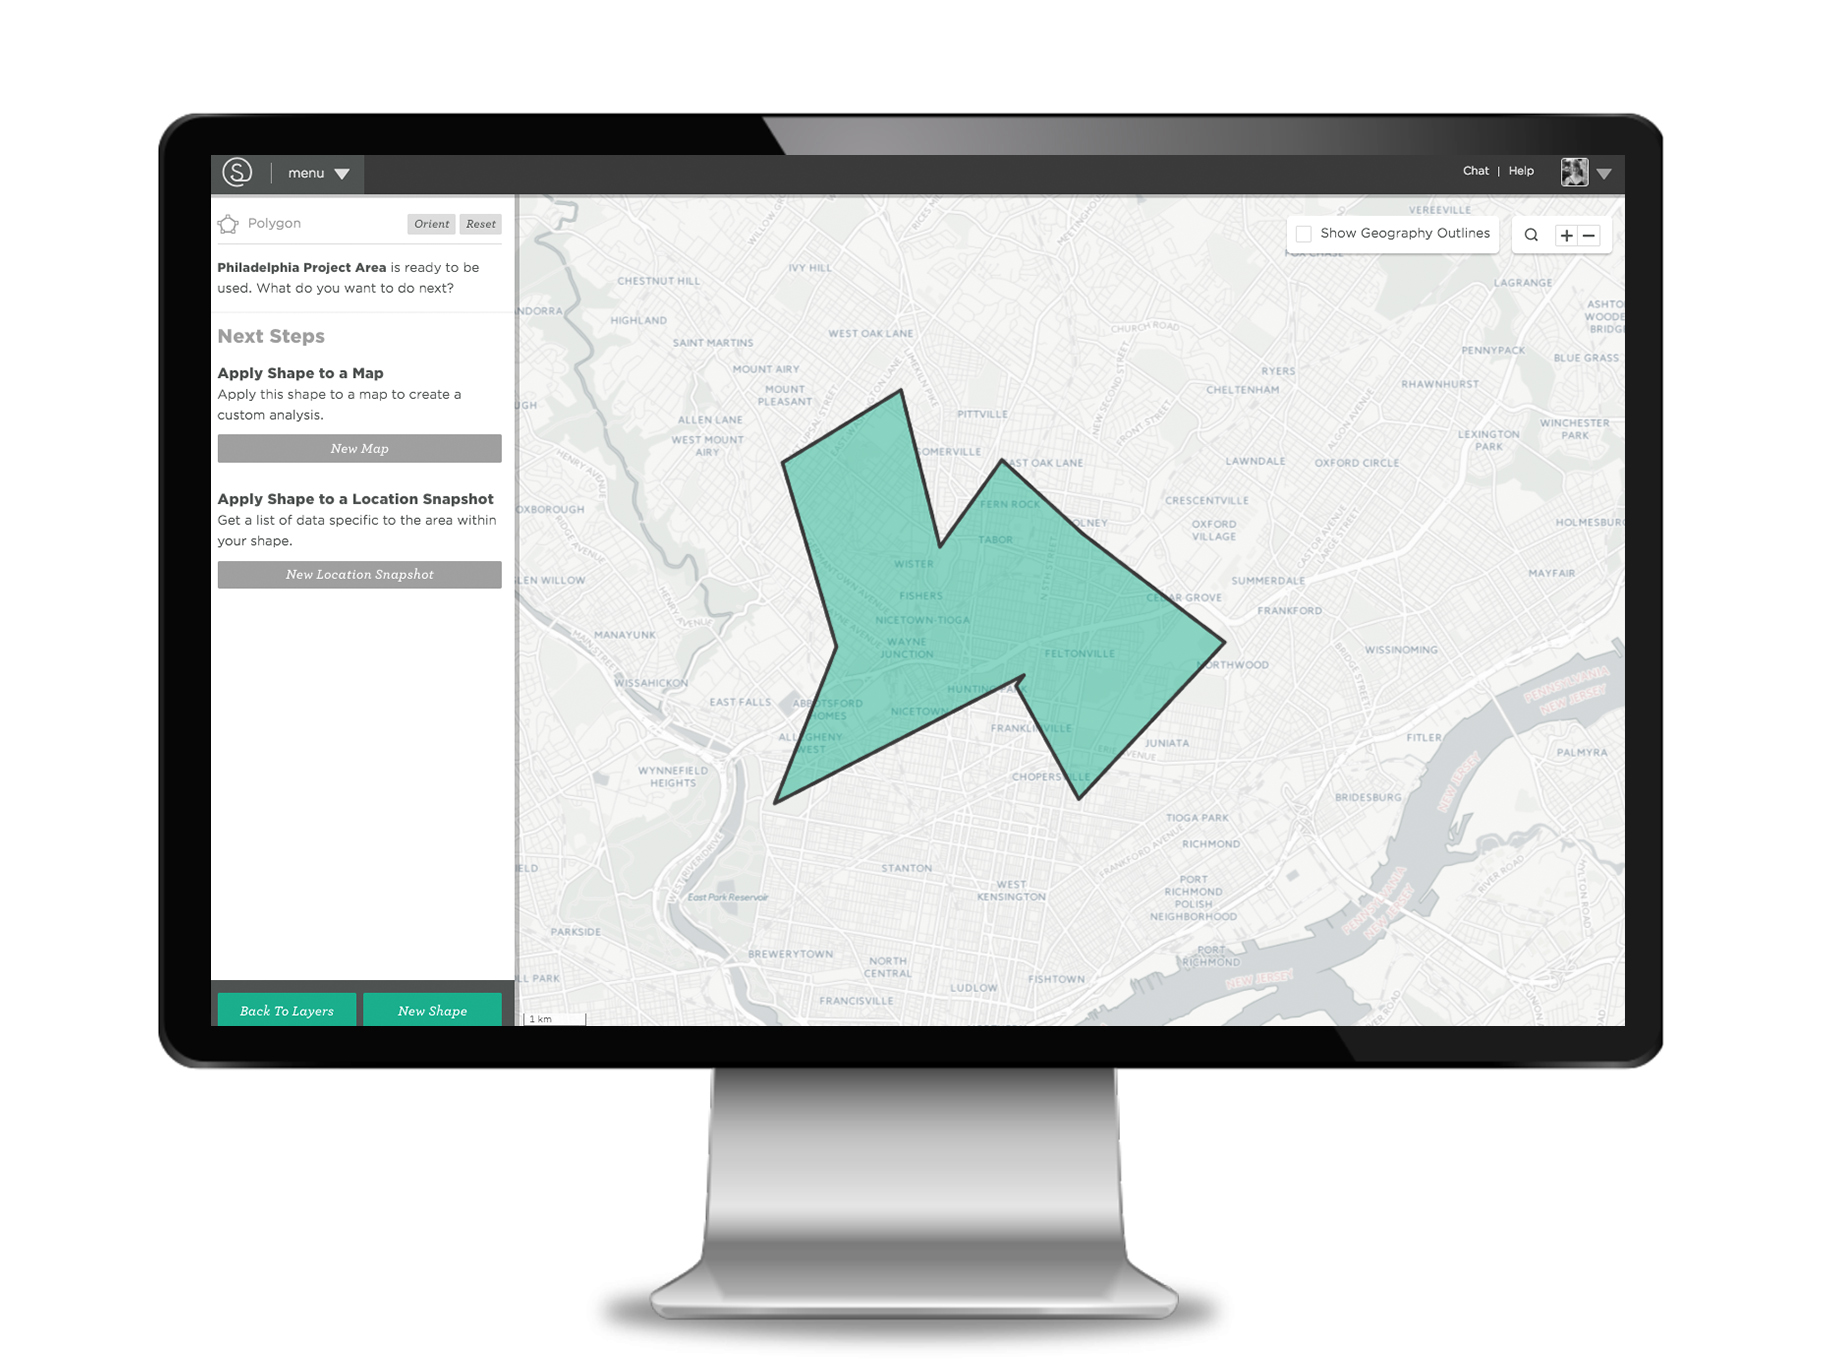
Polygon
Use the Polygon option when you want to draw a custom shape—anything with more than 3 sides. For example, you may want to create a custom polygon for a shape that cuts through census tracts, neighborhoods, or other census geographies.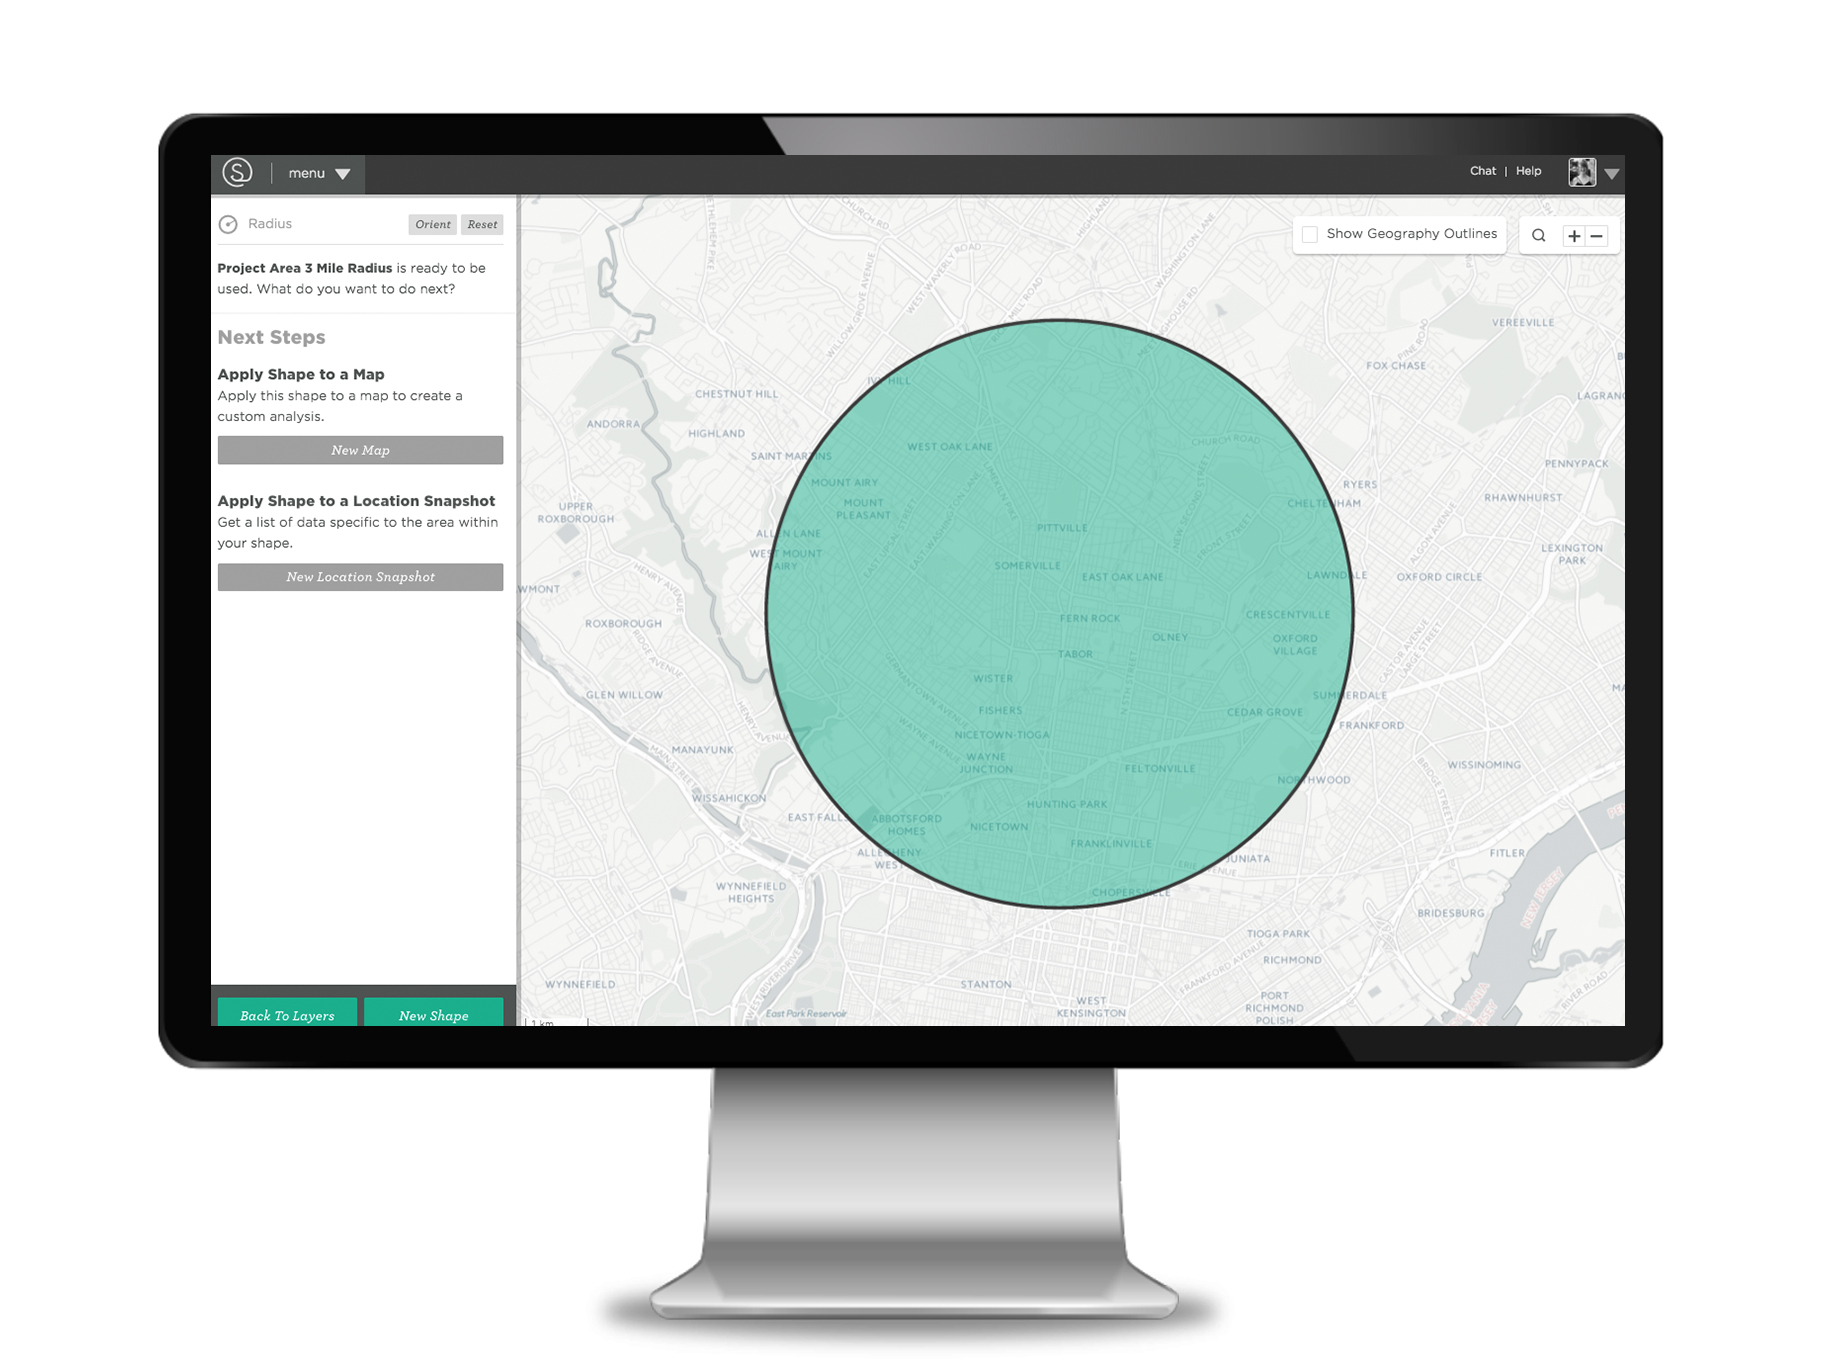
Radius
Use the Radius tool when you want to create a circular distance around a particular point. This is especially helpful for people wanting to get data for an area surrounding a place, such as the demographics for a 2-mile radius around a park, the number of disabled individuals living 1/2 mile around a bus stop, or the economic makeup for a 10-mile radius around a new possible business site.
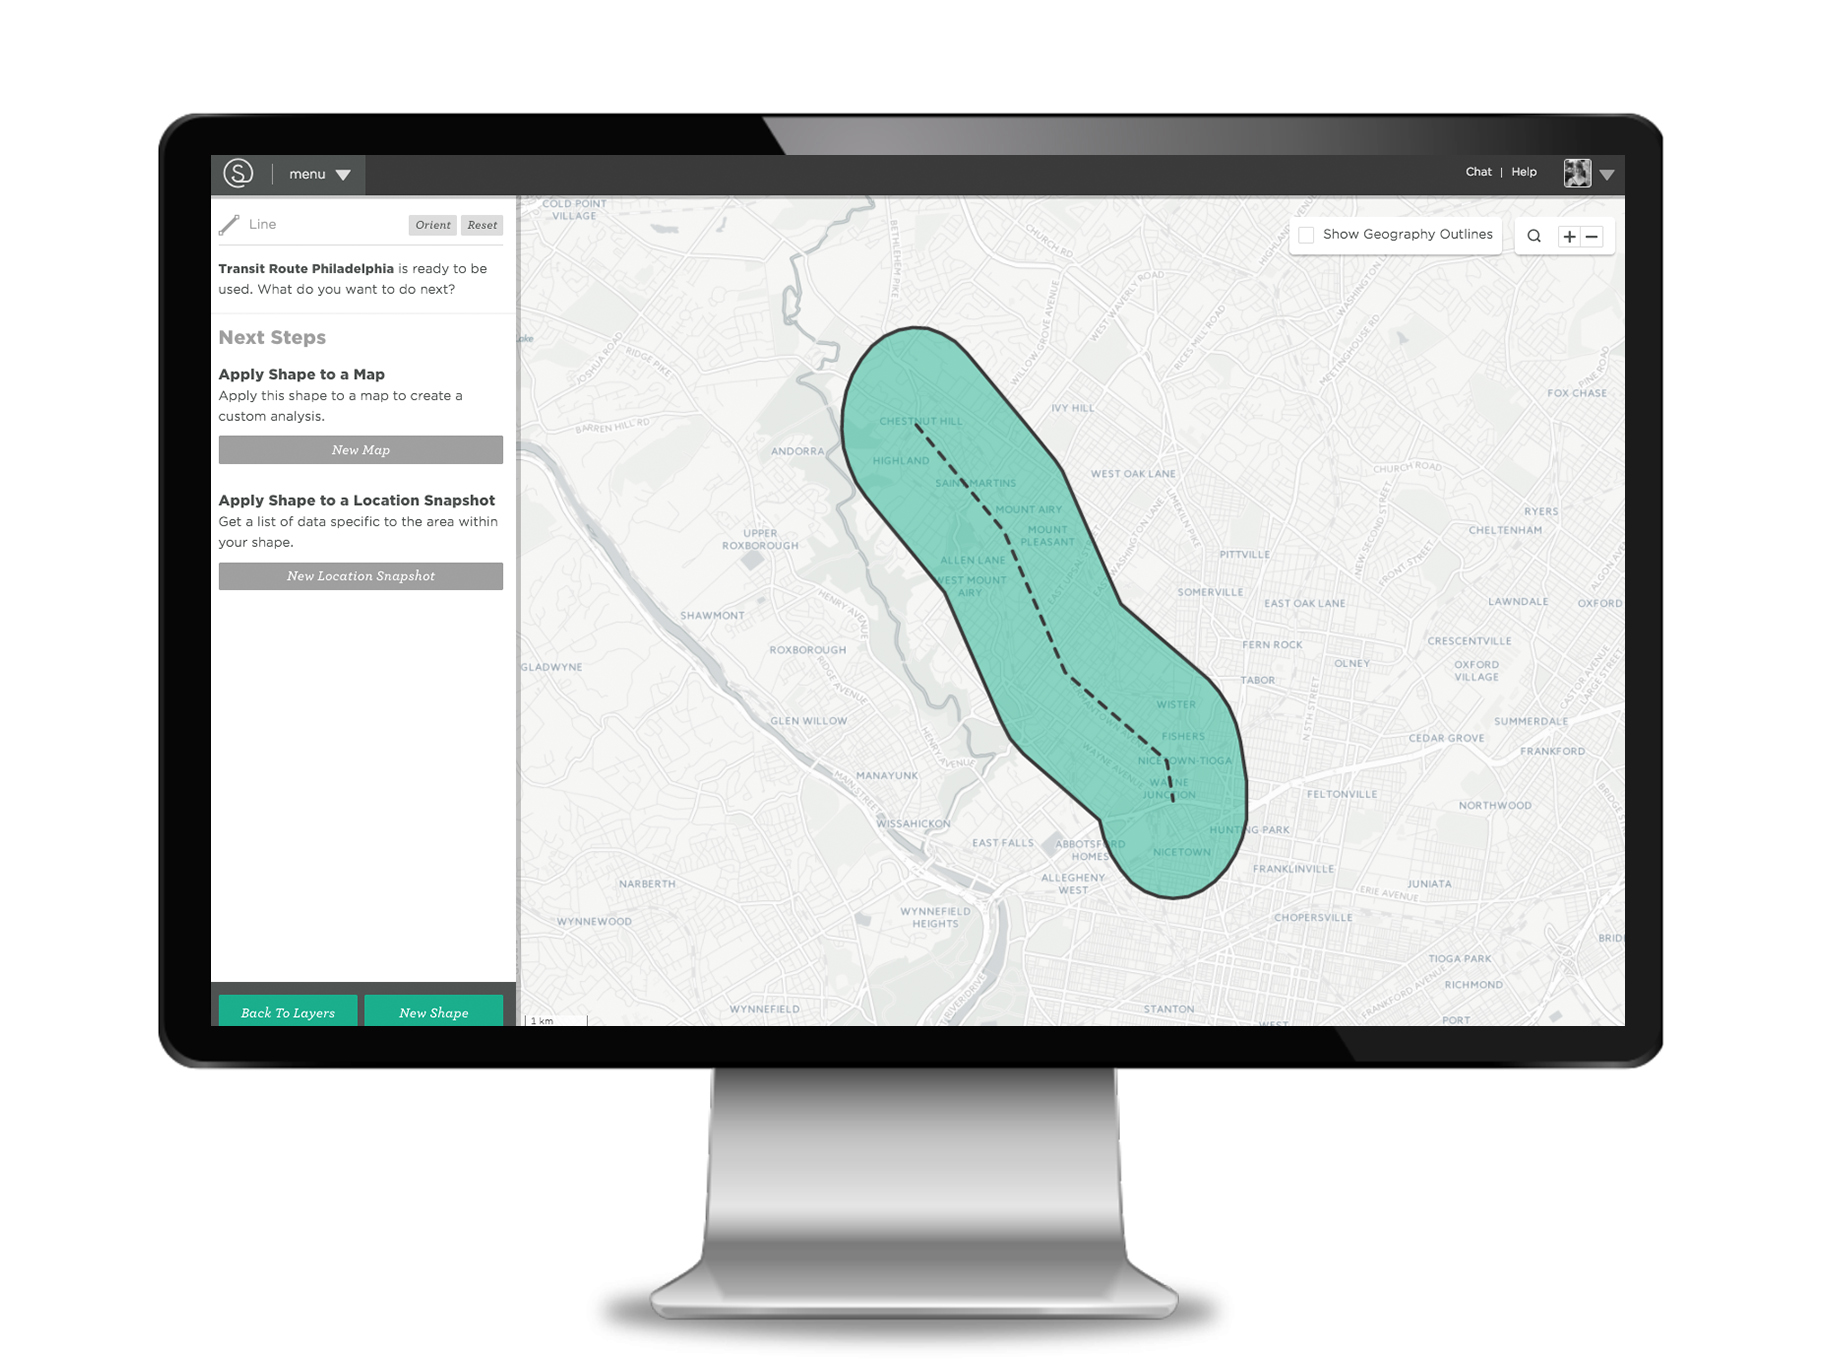
Line
The Line option can be used when you want to create a linear zone of a specified width around a particular location of interest to you—perhaps a bike path, river, or bus route.
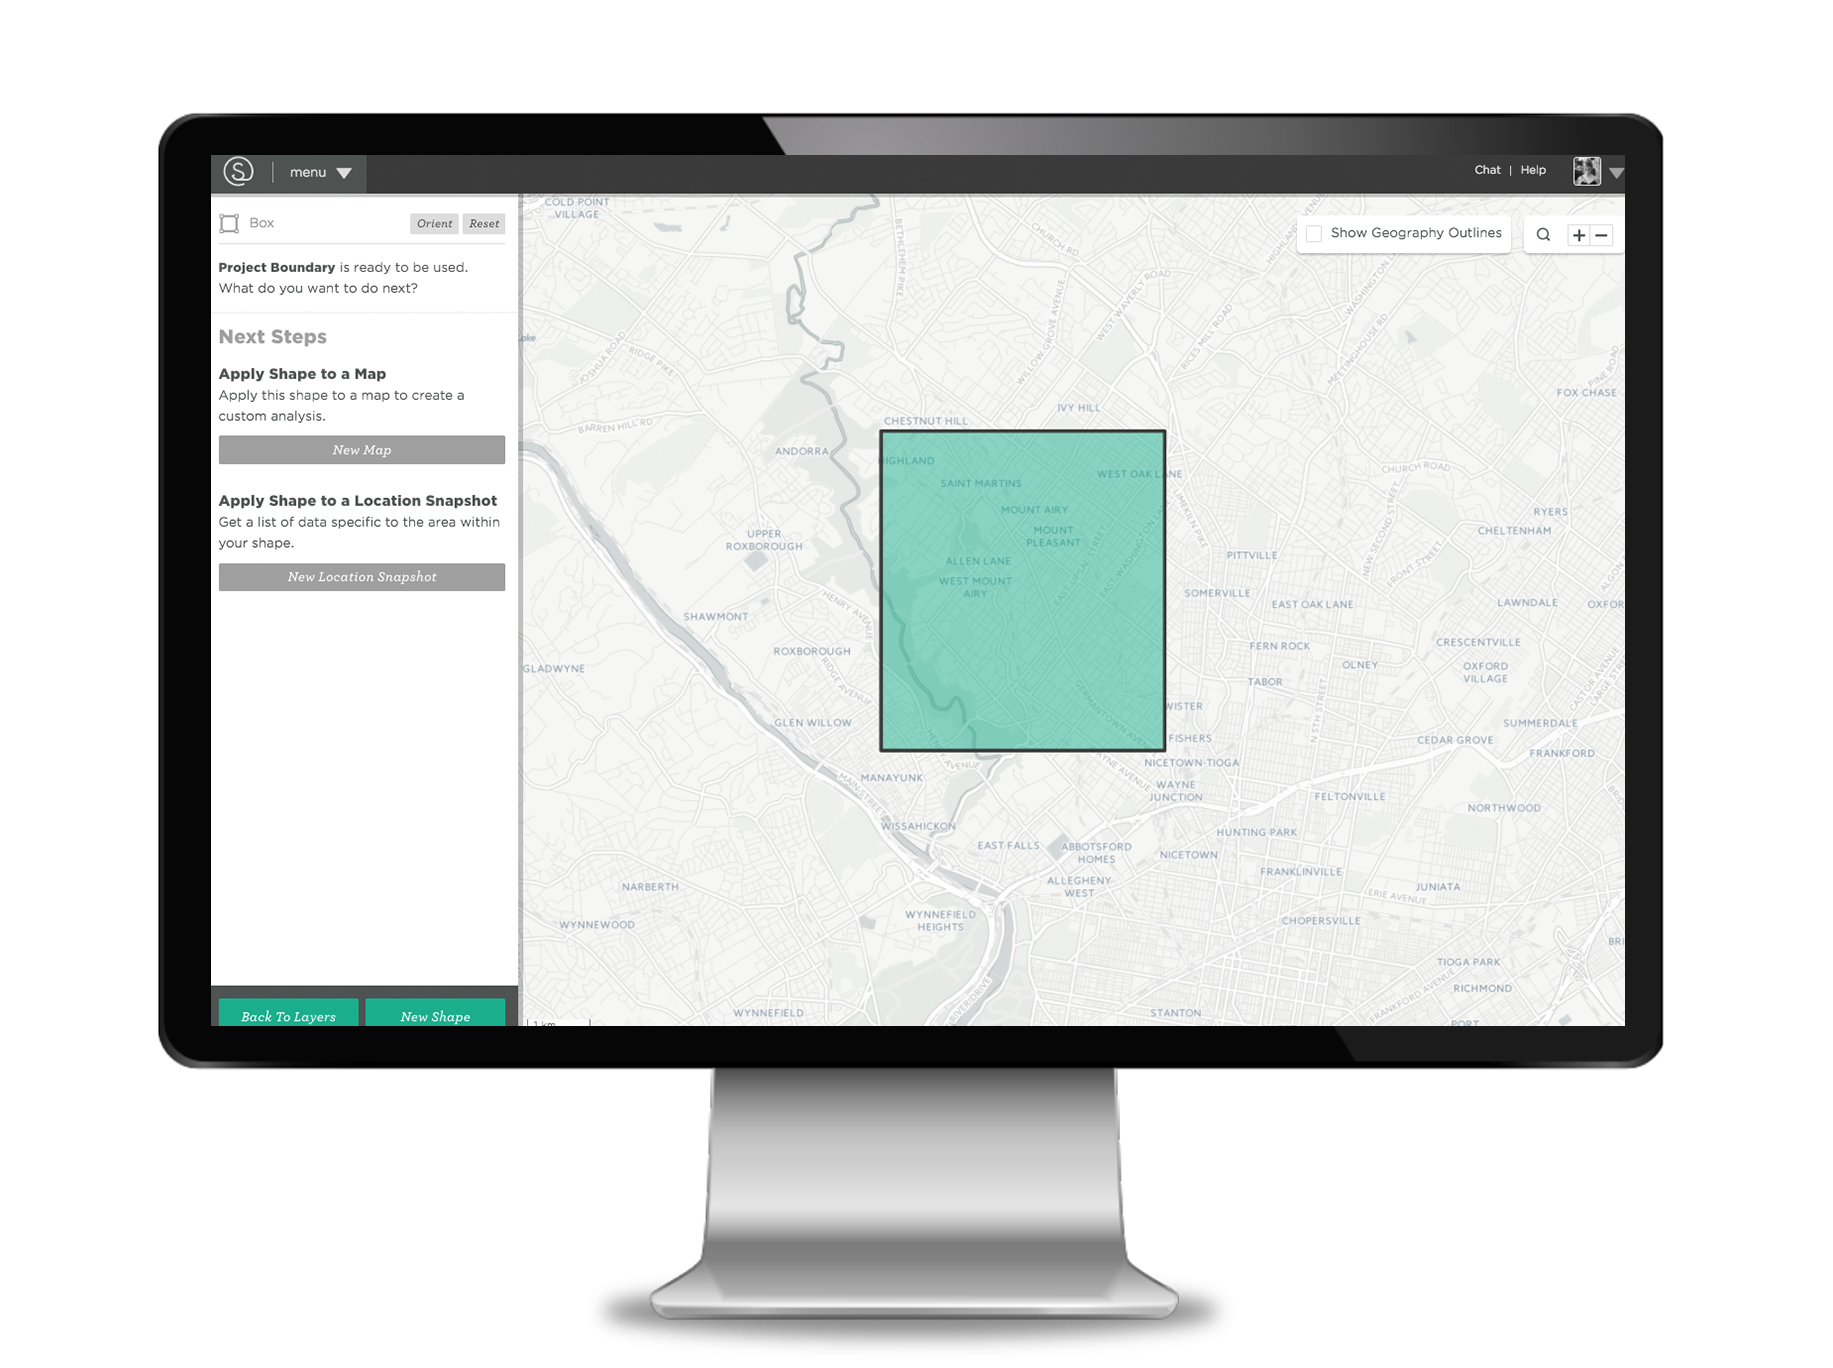
Box
The Box tool is ideal for when you want to create a box or rectangular boundary around a specific point or location.
Our customers can use these shape options in a variety of ways. As a transportation engineer/planner at McMahon Associates, Nick Ferenchak uses GIS frequently. For him, the drawing tool will act as a shortcut.
“I think being able to draw specific study areas will save me a lot of time. Sometimes we’re looking at a corridor, a road or even a trail, and it’s helpful to be able to extract data for that specific boundary. It could be traffic operations, walkability, bikeability, or transit related—like bus routes."
– Nick Ferenchak, Transportation Engineer/Planner at McMahon Associates, Inc.
Whatever your role or project type, Drawing Tools make it easy to get data for custom boundaries on the fly. Try it out for yourself and let us know what you think! And remember—help is always available through our chat option in the top right-hand corner of your home screen.
Interested in learning more about drawing tools? Watch the 11-minute walk-through below or request a demo for your team.
mySidewalk enables our customers to harness data, find critical insights, design impactful strategies, and tell compelling stories that empower change.
With a growing library of best-practice report and dashboard templates supporting city management, fire and EMS performance management, resilience planning, public health assessments and improvement plans, transportation planning, economic development, and community development, mySidewalk is committed to helping local governments, cities, and community leaders track, analyze, and communicate data-driven insights in their communities.
Connect with our team here.
Share this
.png)
The Perfect Fit: HUD Low-Mod Data in mySidewalk

Why The New HUD Rule Change Is a Mission Critical Problem
.png)
No Comments Yet
Let us know what you think