

If you only had $30 to spend at a grocery store, what would you buy to get the most out of your limited resources? Maybe you’d buy some protein, some rice, a handful of produce, and a half gallon of milk. If there was room, maybe you could splurge on a treat for your children. Regardless of how you choose to spend your money, the goal in this scenario is to do the most good with your limited resources.
The same rule applies for state Qualified Allocation Plans (QAPs). States can provide federal housing tax credits to incentivize developers to build healthy, safe and desirable housing with access to whole-health support, such as fresh food or a nearby green space. The job of a QAP is to address the greatest need — in this case, affordable housing. Affordable housing is often a way to alleviate stress on a household’s budget. When households have to spend less on their housing expenses, they free up the budget for other necessities. Unfortunately, existing funding is not enough to solve the problem for everyone, so QAPs must find ways to do the most good with the limited resources that are available.
Indiana Housing & Community Development Authority (IHCDA) oversees the QAP process for the state of Indiana. mySidewalk helps communities nationwide discover and invest in the best affordable housing solutions available to them. IHCDA uses mySidewalk to display their own Opportunity Index and Housing Needs Index to rally partners around housing needs and communities of opportunity with data that is both engaging and built to share.
A Clear Vision on Scoring
To meet their community’s needs, Indiana decided to build their own opportunity score tool. After downloading census tract level data indicators from mySidewalk and producing a set of calculations for each census tract based on their theory of opportunity, IHCDA realized they could re-import their calculations, and provide developers and stakeholders a state-wide map of housing opportunity, which would impact their QAP scoring. Their focus was on driving investment towards the Indiana everyone wanted to see. 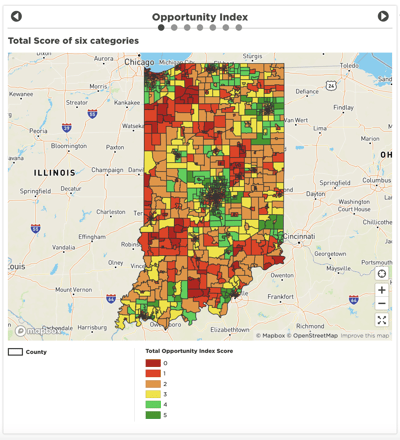
“The real beginning of it was when I had a conversation with Ian Costello at Corporation for Supportive Housing and he showed me their Disproportionality Index,” says Stephen Enz, Real Estate Policy and Data Manager at IHCDA. “It just clicked with me very quickly that if we have the ability to take our data and plug it into [the mySidewalk] map, and display the results on a county by county or, in our case, a census tract by census tract format, I saw great opportunity there.”
Stephen and his teammate, Real Estate Data Analyst Dakota Coomes, wanted to be crystal clear about the scoring. “The scoring is a place where we want to provide transparency in what we're doing, we want to provide the information, and in an easily accessible format,” he says.
As Stephen and Dakota analyzed Indiana’s 2023 QAP, they realized they could dive more deeply into the data. “We found places where we wanted to drill down to the census tract level instead of, for example, the county level,” he shares.
Hamilton County, which is north of Indianapolis, is a wealthy county within Indiana — but that doesn’t mean that pockets of poverty don’t exist, Stephen says.
“If all of Hamilton county gets the same score, then you're doing a disservice to these pockets that still may very well need some affordable housing,” Stephen adds. “The same thing is true the next county over, but in reverse. So it's a relatively poor county, but they also have some pockets of wealth. So you don’t want to treat that whole county as homogeneous, either.”
When Stephen learned that it was possible to add scores and plot addresses within the mySidewalk platform, he knew this tool was what IHCDA needed.
An Overview of the Scoring Maps
Three sets of maps are interspersed throughout Indiana’s report. The first set of maps are for the Opportunity Index. Although the Opportunity Index has evolved over the years, Stephen says IHCDA had specific data points in mind. However, they wanted to be sensitive to how local communities are treated by census tract.
“The data was available on so much more of a granular level, that’s when we started talking, “Okay, which ones of these are we going to do by county? And which by place and which by census tract?’” Stephen says. 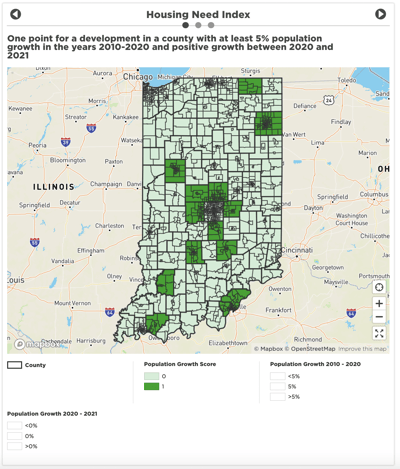
The very first map visualizes the total number of points available per census tract, as they relate to six of the eight categories within the Opportunity Index. Additional maps provide detailed information on low poverty, low unemployment rate, and access to primary care. Depending on how a potential development meets the criteria in the first set of maps, applications can earn up to seven points.
“We were, you know, kind of pleased with the ability within mySidewalk to overlay census tract information both from the Census Bureau or from our scoring and overlay that on top of county information, whether that's from the Census Bureau or from ours,” Stephen says.
The second set of maps cover Population Growth, which is a necessary scoring category for the Housing Need Index. Applications are awarded a single point if a potential development is “located within a county experiencing population growth, based on data from 2010-2021 pulled from STATS Indiana,” the report states.
The last section of the Indiana 2023-2024 QAP helps determine if a development application is located in a Qualified Census Tract (QCT) or Difficult to Develop Area (DDA). If an application meets the requirements, it is eligible to increase the eligible basis by up to 30%.
Next Steps
With the QAP report in place, Stephen says that the next big project for his team is to map the 800 active projects in their portfolio.
“I think Dakota and I both get a kick out of figuring things out,” Stephen says.
If you’re ready to make the best affordable housing investments for your community, contact us today.

Share this
%20copy.png)
Generating Affordable Housing Insights for the State of Nebraska
Locate Your Community's Affordable Housing with Data from the NHPD

No Comments Yet
Let us know what you think