

We believe that data in the right hands can make a better world. This has never been more apparent to us than in the past 12 months. That’s because data has done some incredible things this year. Here are just a few examples: We have sheltered at home watching Covid cases rise and fall; we’ve informed ourselves about structural racism during a growing Black Lives Matter movement; we have worried about our friends and families while watching unemployment numbers skyrocket; we’ve cheered for a moratorium on evictions while renter burden increases. Data, and their stories, have informed us, moved us, made us cry, had us cautiously optimistic, and so much more. I don’t think there has been a time in our lives where data has played a more important social role.
At mySidewalk, we have learned so much from our partners as they’ve used this data to respond to challenge after challenge. Throughout the year our goal has been to discover great ideas and make them available to all our partners. This year alone we have launched new solutions that track Covid cases, help residents stay healthy, measure Covid’s impact on unemployment, evaluate local digital divides, assess fair housing, improve community engagement strategies and more. We continue to be inspired by our partners every day as they work alongside communities.
5 key lessons have guided us throughout this year of building new solutions. These lessons come from conversations with our partners and how they have used data this year to improve the communities they impact. They are that:
- Place still matters
- Equity is in all things
- Stories are how people learn about place
- Data is for everybody
- It’s the impact that counts
Below are how our partners are using mySidewalk to ensure these 5 lessons are integrated into all their data work.
1. Place still matters.
Back in 2007, under the specter of an already unraveling housing market, research institute PolicyLink wrote a set of recommendations for how to build healthier neighborhoods. Their mantra was that ‘place mattered’, and that where you live can determine your health outcomes. Today we face brand new challenges, but it is clear that place still matters. Research continues to confirm that your zip code is a better predictor of your life outcomes than the school you attend, the healthcare you receive, or the lifestyle you lead.
The mySidewalk platform has helped our partners access the largest and simplest place-based data on the market. Here's what makes our technology unique: We have data available for custom, hyper-local geographies. That means on-demand data for neighborhoods, city council districts or wards, as well as for census tracts and census block groups. It also means the ability to pull data for custom-drawn geographies such as neighborhood business districts, corridors, project areas, TIF districts, opportunity zones, and more.
Want to see an example? Here is a sample Community Engagement Report from Cincinnati in their Walnut Hills Business District. Our partners are using the mySidewalk platform to get factual information about any place, no matter its shape. They do this because place still matters.

For our partners at Enterprise Community Partners, place is at the center of everything they do. That is why they chose mySidewalk to build their Opportunity360 Community Dashboard. This tool helps partners access community data for determining where action is needed the most anywhere in the United States. “Working with mySidewalk has allowed us to operationalize community data in a way that’s accessible to everyone who reviews it. mySidewalk really democratizes data. They don’t just publish information, they help you understand it.” - Stephany De Scisciolo, VP, Knowledge, Impact & Strategy at Enterprise Community Partners
2. Equity is in all things.
Equity is not a verb, it is a state. In her article, “There Should be no Such Thing as an Equity Dashboard”, Dr. Sarah Martin argues that equity cannot be sectioned out into its own initiative, its own team, or even its own dashboard. Rather, equity should be at the core of all your work, in every plan and strategy. That is why the most equitable outcomes come from initiatives that have equity built into them from the start.
This past year our partners have demanded more ways to achieve an equitable state. That is why mySidewalk has built tools to ensure equity is at the first step of all their data work. We help you accomplish this in 2 simple ways: 1) visualize data that is disaggregated by race/ethnicity, and 2) correlate local data with mySidewalk’s data on race and ethnicity.
- Visualizing disaggregated Data that is by race/ethnicity: The mySidewalk platform equips partners with data disaggregated by race and ethnicity to help understand equity issues. These include indicators such as household income, homeownership, mortgage lending, educational attainment, chronic health conditions, cause of death, access to healthy food, access to a computer, and much more by race and ethnicity. For example, you can see in the chart below a significant gap in household income and homeownership rate by race/ethnicity in the United States. Our partners use this data for their communities to start new conversations toward more equitable practices and programming.

- Correlating your local data with mySidewalk demographic data: Thanks to the ability to add your own geographic data into your mySidewalk account, you can easily correlate your local data with ours to discover new insights. This can help you find a signal of truth within a lot of noisy data. For example, here is a report that compares Covid-19 case rates with communities of color in Kansas City, MO. The correlation found that communities of color are, in fact, experiencing higher rates of Covid-19. This same technique works for understanding the impact of any of your projects or programming.

3. Stories are how people learn about places.
Covid has dramatically changed how people experience place. When talking with our place-based partners like community developers or downtown associations, we hear their struggle to tell new stories during the pandemic that promote both progress and safety. However, for our partners working in more disinvested neighborhoods, that challenge has always been present. The challenge is: how do we attract attention and investment when all anyone wants to talk about is the risk? The answer is good storytelling.
Too often our most disinvested neighborhoods are not in control of the stories being told about them. Whether through the media, through politicians, or other means, poor storytelling can damage the hard work we put in every day to highlight the assets, skills, and incredible people within our neighborhoods. Unfortunately, stories of crime, violence, poverty, and decay have taught residents about which places are worth their time, and which are not. mySidewalk helps you focus on building powerful counter-narratives about places from a position of strength. With mySidewalk you get to build stories with data to prove that this neighborhood is, in fact, worth your time and investment.
The honest truth is that data by itself is not enough to change people’s minds. Data is not how people learn about places. Stories are. mySidewalk is built to help you share compelling data stories with residents and stakeholders. Before using mySidewalk, several of our partners have identified that they have avoided storytelling, admitting that they need to improve. If you have been hesitant about sharing your work as a story, come chat with our team and we can help you get started.
To get you inspired, here are some of the stories our partners are sharing with their communities about some challenging topics.
- The Kansas City Race and Equity Initiative
- Special Report: Marijuana Use in Oakland County, MI
- Lifting The Label: Understanding Opioids
- Impact of Covid-19 Crisis on Women in Missouri
4. Data is for everybody.
This past year we have seen stories where data has not been collected properly or made available to the public. In some cases, data tools are actually built to prevent sharing information, opting to equip only data professionals with good insight. But at mySidewalk, we believe that data is for everybody. That is why we have invested heavily in ensuring everything our partners build is instantly ADA compliant, mobile-friendly, web-based, printer-ready, downloadable, social media accessible, and more. Hands down, mySidewalk is the most accessible and friendly platform for publishing data and information.
We see this most often when our community development partners work with mySidewalk, and their first project is to publish data for every neighborhood, every council district, every zip code, and every topic they want.
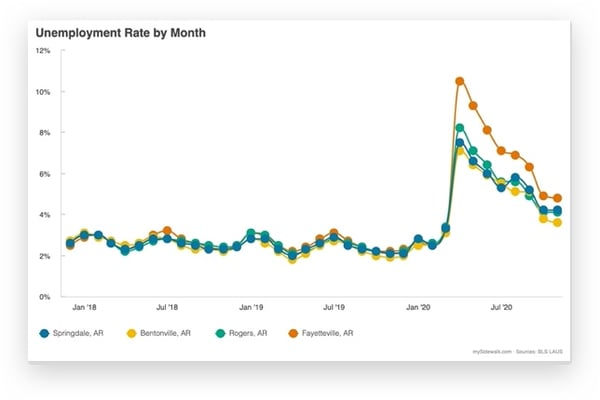
Take Springdale, AR. They have a small but mighty team that, when given the keys to the mySidewalk platform, immediately started building community reports to share on their website. One of my favorites is their report on the impact Covid-19 has had on their local economy.
Or take Fort Worth, TX. Their team published dozens of reports for each zip code and council district in the city. This was easy to do because mySidewalk automates geography selection, meaning Fort Worth staff only had to build out 1 report and duplicate it for each geography. These reports are now openly accessible to help community organizations write better grants, make better decisions, and stay on the same page in their work. mySidewalk makes data available to everybody.
5. It’s the impact that counts.
At the start of your first mySidewalk training, we ask our partners how they’ll measure success with the mySidewalk platform. For example, one of our most recent trainings was with Atlas Community Studios, an organization that “helps rural communities plan for growth through collaborative strategic planning and simple to execute, realistic plans.” When asked how they will measure success with mySidewalk, they answered:
- Did we use the mySidewalk platform in almost all of our projects?
- Did we create new value for our clients?
- Did it make our process easier?
After a year full of new challenges, we get that it’s the impact we make with your team that gets counted. For some of our partners it’s as simple as using mySidewalk to add value in an easier way. For others it’s about accessing data, or assessing community inequities, or telling a compelling story. Whatever your reason for using data and storytelling, we want to hear about it.
Come chat with our team.
Share how data and storytelling are making an impact in your community, or how we can help.

Share this
![Customer Spotlight: Next Level City KPI Transparency [Video]](https://www.mysidewalk.com/hubfs/mySidewalk%20Customer%20Spotlight_City%20Performance%20Dashboard%20%5BVideo%5D.png)
Customer Spotlight: Next Level City KPI Transparency [Video]

A Quick Guide to the (New) 10 Essential Public Health Services

No Comments Yet
Let us know what you think