

We know how impactful our customers’ work is. That’s why we work hard to keep our platform up-to-date with the latest data, features, and polishing to help you do what you do best. Whether you work in City Performance, Public Health, Fire, Economic Development, or Transportation, we want to make your job easier.
New to mySidewalk? mySidewalk is a community intelligence platform that brings data science to the public sector. We empower you to prove the value of your work so you can drive progress.
If you’re a mySidewalk customer, keep reading to get the details on our three latest and greatest enhancements and new features. (If you're not a current customer, you can learn more about us here).
We’ll cover:
- The new ACS Update
- CDC 500 Cities Update
- New Feature: Custom Callouts
1. ACS Update
Each year, the U.S Census Bureau conducts the American Community Survey (ACS) to provide important information to local communities. Now, we’re just as excited for the upcoming 2020 Census as you are, (did you know it kicked off last week in Alaska?), but the ACS is fundamental for up-to-date information at a local level too.
Government agencies use it for making data-driven decisions and determining how to allocate over $675 billion into their communities across the country. As a mySidewalk customer, it’s one of (many) powerful building blocks for sharing your community’s story, available at your fingertips.
If you can’t tell...we’re pretty excited to say all mySidewalk data visualizations based on ACS 2013-2017 5-year estimates have been updated with the 2014-2018 estimates. Our gift to you - delivered Dec. 24th. Have you explored this data with your community yet?
Share how you use it online and tag us @mySidewalkHQ. For more on the ACS, check out our detailed update or read about 5-year estimates vs 1-year estimates.
2. CDC 500 Cities Update
We didn’t stop there. The Center for Disease Control (CDC) recently updated its 500 Cities data, which is now available mySidewalk platform for applicable geographies. This offers an up-to-date, deeper look into public health in hundreds of the largest cities in the country. No need to rely on another entity for your data. We got you.
Take a peek at some of the updated indicators with new years of data to explore, available for select geographies.
To keep fueling our ever-growing data library, we also added new data from the U.S. Department of Housing and Urban Development, the Bureau of Economic Affairs and more.
Create a new report and explore our data library to see what’s available for your community!
3. New Feature: Custom Callouts
Calling all customizers! We’re always impressed with the creativity our customers put in their visualizations, and we love giving you the tools to tell your story in your way. That’s why this month we added the ability to create custom callouts.
Until now, callouts had to either utilize our preloaded system data or customer-uploaded data. We’ve heard you say that sometimes you need a little more flexibility. So, you can now add callouts with manual inputs and labels!
Check out this custom callout we made to celebrate.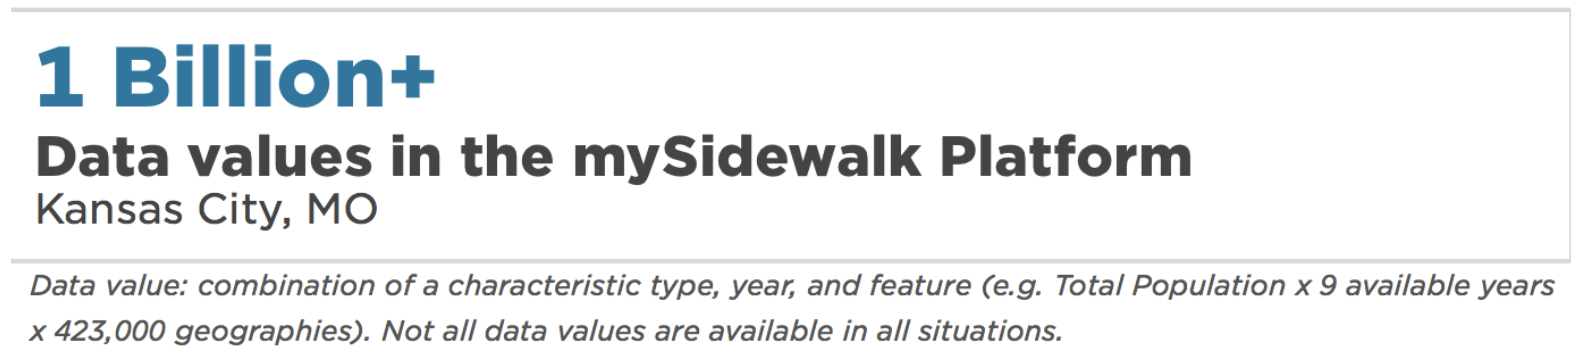 Oh yeah, didn’t we mention? All of those new data updates have brought us to over 1 billion data values across our system! We hope you’re finding them useful.
To learn more about creating callouts check out our guide here.
To all our customers, thank you for your tireless work. We know it’s cheesy, but our work is much more meaningful because of what you do. We’re genuinely excited whenever we see you launch a new dashboard or new report. Thank you for all the ways you strive to improve your communities.
If you’re not currently a mySidewalk customer, you can learn more about how we bring data to public service here.
Share this
.svg)
When Uncertainty Meets Resilience: How mySidewalk is Expanding and Protecting Access to Mission-Critical Data
-Jun-13-2022-03-57-11-46-PM.png)
GoDaddy's Venture Forward Collaborates with mySidewalk to Create Microbusiness Impact Report

No Comments Yet
Let us know what you think