

Why does this question matter?
Access to convenient, reliable transportation is critical for a high quality of life. Residents without viable transportation options will find it harder to stay employed, to eat healthy meals, or see a doctor. In the US, our car-centric infrastructure means that access to transportation is often synonymous with car ownership. But many families cannot afford to own a car, and a growing number are choosing to go car-less for health, environmental, or other social reasons.
There is a growing body of research confirming the benefits of creating places that encourage diverse means of transportation, including walking, biking, and transit. And many cities are using that research to make positive investments in infrastructure, such as complete streets and mixed-use developments, that support a multi-modal lifestyle. When it comes to choosing where to make those investments on limited city budgets, prioritization can be key.
One critical way cities can prioritize areas for mixed-use developments and multimodal infrastructure is to identify where residents without vehicles currently face the lowest community walkability.
When and where to use this map
This map is designed to help you identify households with limited transportation access based on whether the household has access to a vehicle, and whether the surrounding environment has low walkability, as measured by the EPA. The EPA Walkability Index combines multiple measures of walkability into a single Index score: employment diversity, employment-housing mix, intersection density, and proximity to transit. When this map is complete, visible block groups in the darkest shades are strong candidates for prioritization. This map is a helpful jumping-off point for measuring transportation barriers and can be easily part of a larger analysis of access to specific resources, such as employment or grocery stores.
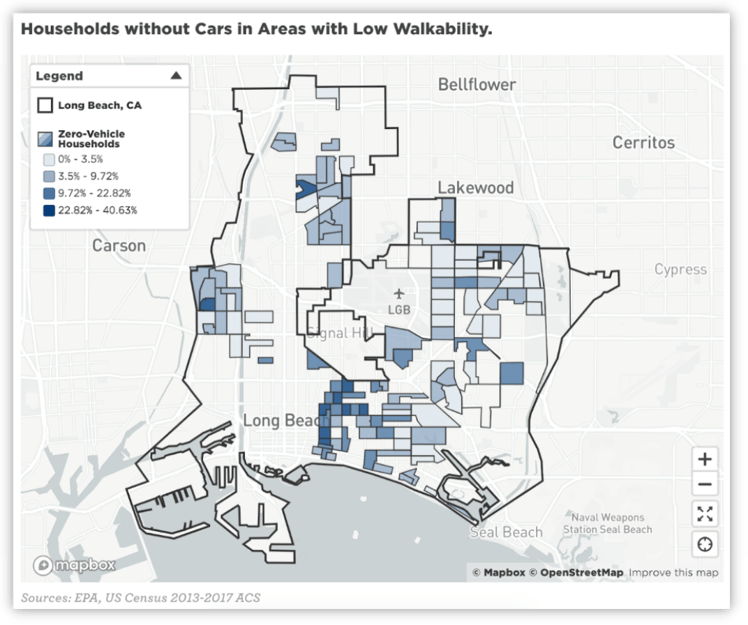
The map below shows the percentage of zero-vehicle households in census tracts where the Walkability Index is less than 10 (low walkability). You can create this map for your community in mySidewalk.
How to create the map in 10 minutes
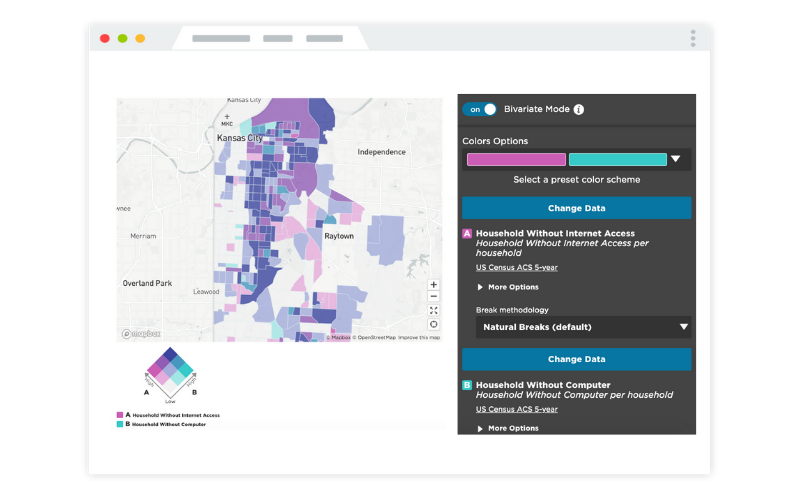
Watch the screen recording or follow the steps below.
-
Open a report in the mySidewalk app and create a new map. Click Add mySidewalk Data Layer and select your city’s geography. Select Census Block Groups as your sub-geography in the drop-down menu.
-
Select Style by Data. Using the search feature, add “Vehicles Available for Occupied Housing Unit: No Vehicles” data. We’ll want to normalize this (using the drop-down menu) by “Total Housing Units” and display the format as “Ratio as Percent.” Select the blue Back button to return to the base layer settings.
-
We’ll now filter those census block groups to find the ones that also have low levels of walkability. Click Add a Filter followed by Select a dataset. Using the search function, find the dataset “Walkability Index.'“ Add the data titled “Walkability Index.” Make sure the the Filter Type is set to Value. From the Operator drop-down, select At most and manually input the value as 10. Once filtered, select Done to return to the main menu. Your map should now display only those block groups with low walkability.
If you find there are many areas in your community with relatively low walkability, you can customize your filter to further narrow your prioritization to show the areas with the least walkability. To do so, set the Filter Type to Percentage. From the Operator drop-down, select At least, and manually input the value 50. Once filtered, select Done.
This is a quick and powerful map that you can create on your own in 10 minutes or less! If you would like help getting started, connect with us.
Your transportation assessment can do more. mySidewalk can help.

mySidewalk helps traffic agencies and Public Transportation departments transform their studies and assessments. Learn more.
Share this

mySidewalk Introduces Drawing Tools

We Believe in Your Data—Here's Why
No Comments Yet
Let us know what you think