

Over its history, Vitalyst Health Foundation has invested nearly $125 million into Arizona health improvement by supporting efforts that range from building local community gardens, to pushing for better statewide health policy. They’re on a mission to connect, support, and inform efforts to improve the health of individuals and communities in Arizona. We help them accomplish this mission by collaborating and creating their Health Data Dashboard.
![]()
Vitalyst had 4 main goals for their dashboard:
- Communicate an unequivocally clear message that health is more than health care - that it is a function of place, access, and opportunity, not simply a personal responsibility.
- Examine the root causes of health and demonstrate the relationship between outcomes and social/environmental determinants.
- Tap into data's potential to help build consensus and compel community leaders to take meaningful actions to address the Social Determinants of Health (SDOH).
- Tell a concise, compelling story that is worthy of being the basis for discussion/action and can serve as a model for Arizona stakeholders.
For the Vitalyst team, data was difficult to acquire, process, and visualize. In years past, their team was frustrated by inadequate physical maps when trying to visualize place-based health data. Building a comprehensive and detailed understanding of SDOH across the entire state of Arizona was a significant challenge.
The solution
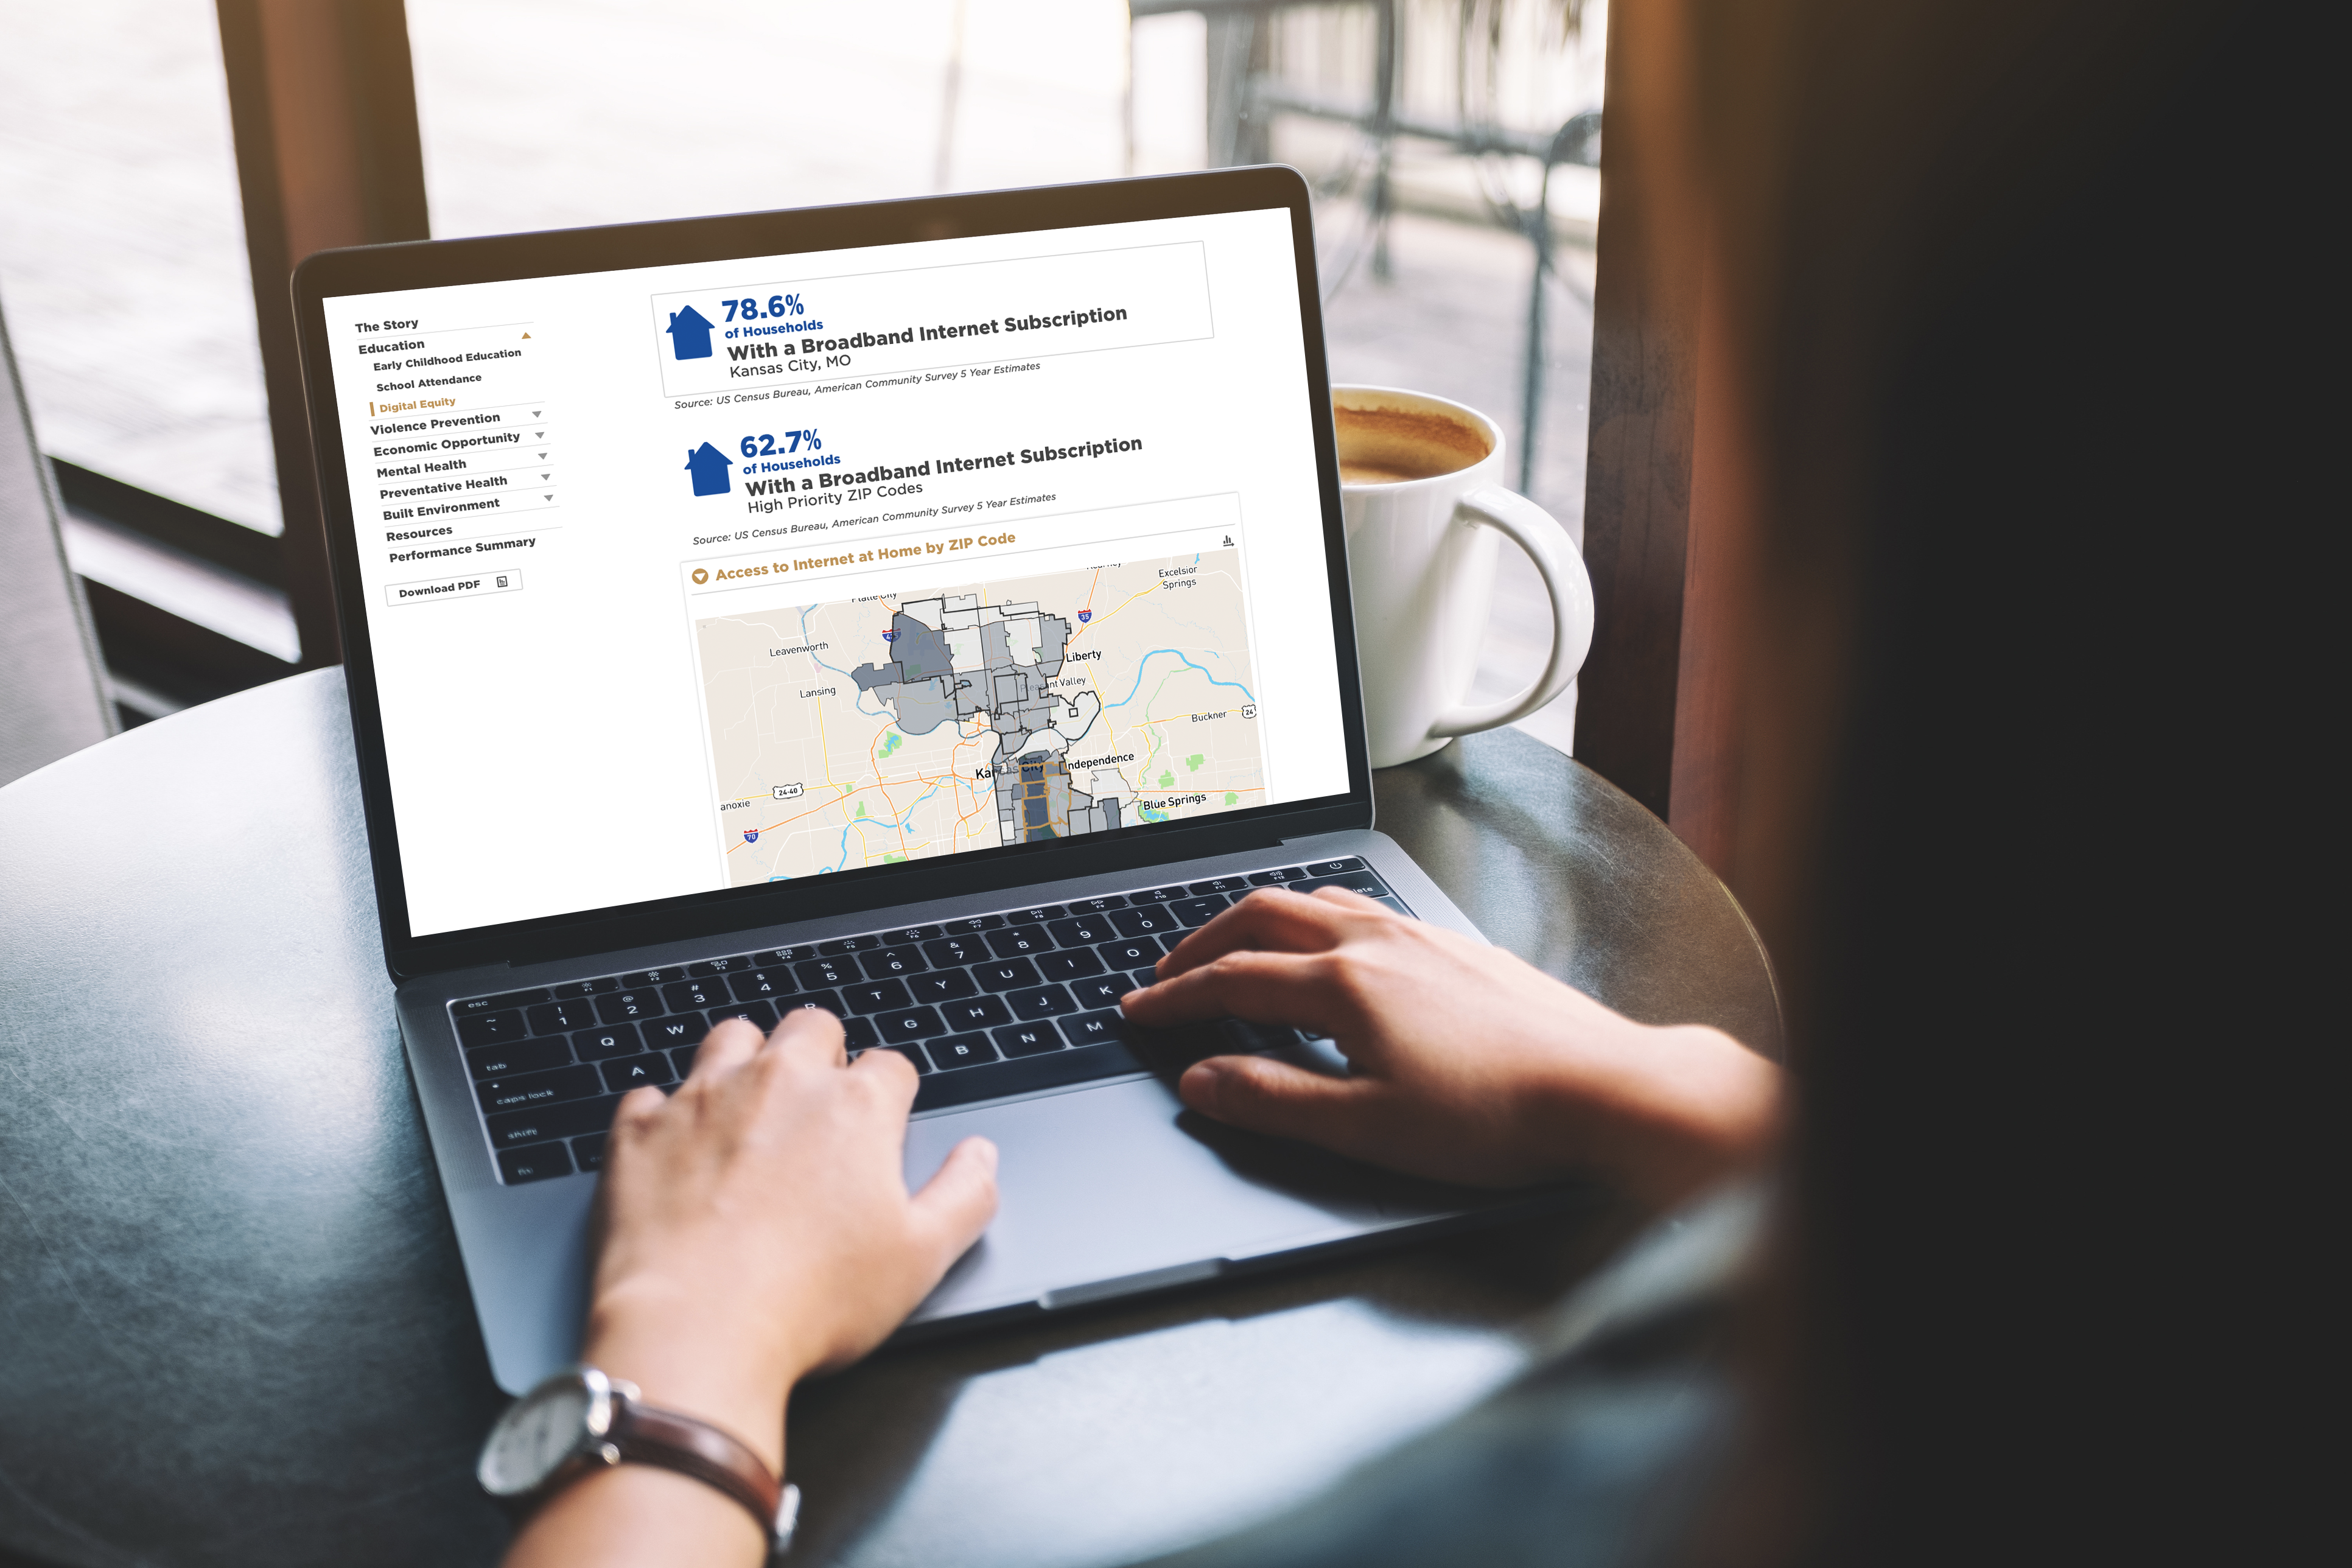
We partnered to create a dashboard that reflected Vitalyst’s unique framework for SDOH data and rationale for their approach to funding and advocacy. The Vitalyst Health Data Dashboard displays a breadth of community-level data on housing, transportation, education, climate, equity, and the other elements of a healthy community.
Through mySidewalk platform access, Vitalyst also now has access to over 1.1 billion data values from 40+ different sources, as well as our one-of-a-kind report creator. This enables the team to produce different reports for different causes. For example, see their Concept for Educational Equity Index. This report analyzes social metrics to better understand the quality of education for local students; a game-changing report for the future of Arizona school districts. In addition to school funding and performance, Vitalyst has made reports to support their work in health insurance access, eviction risk, and more.
Your CHA can do more. mySidewalk can help.

mySidewalk helps health systems and Health organizations transform their Community Health Assessments. We partner with you to create custom, dynamic dashboards that help you: get 10x the stakeholder engagement, improve data accuracy, cut costs, and save time. Learn more.
Share this
A Complete Picture of Health: Introducing the80

Bridging Health Disparities with Data: mySidewalk's Journey to Data-Driven Empowerment
No Comments Yet
Let us know what you think