

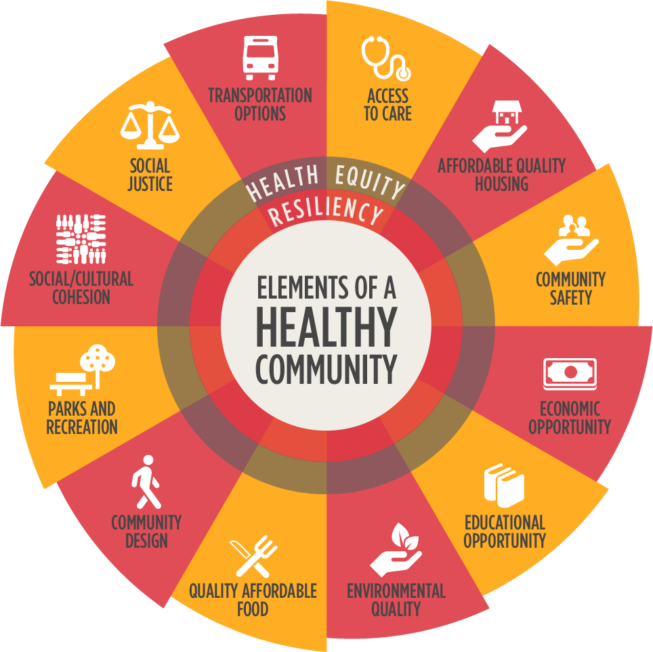
80% of what makes us healthy or unhealthy happens outside of the doctor’s office and in our neighborhoods and greater enviornment. COVID-19 placed a spotlight on health inequities and the critical role Community Health Workers play in helping members navigate numerous systems of care throughout the pandemic.
That's why Blue Shield of California and mySidewalk collaborated to launch a new data storytelling tool designed for Community Health Workers called the80. We developed this tool together to help Community Health Workers and Community Health Advocates (CHAs) use data to help patients, providers, and community-based organizations. It gives what health care professionals call “social determinants of health” data — chronic disease, income and other stats — giving those providing care and resources to those at risk the whole story.
.gif?width=748&height=499&name=the80%20Mockup%20Plain%20(1).gif)
The purpose
the80 equips CHAs with the data they need to align community and individual needs with available resources in action planning and advocacy. With this online tool, CHAs can access community-focused data stories on housing, transportation, food systems, educational opportunities, and community context. This enables anyone to make the connection between community-centered data and chronic illness in seconds, and to advocate for new programs, services and policies that address true health inequities.How it works
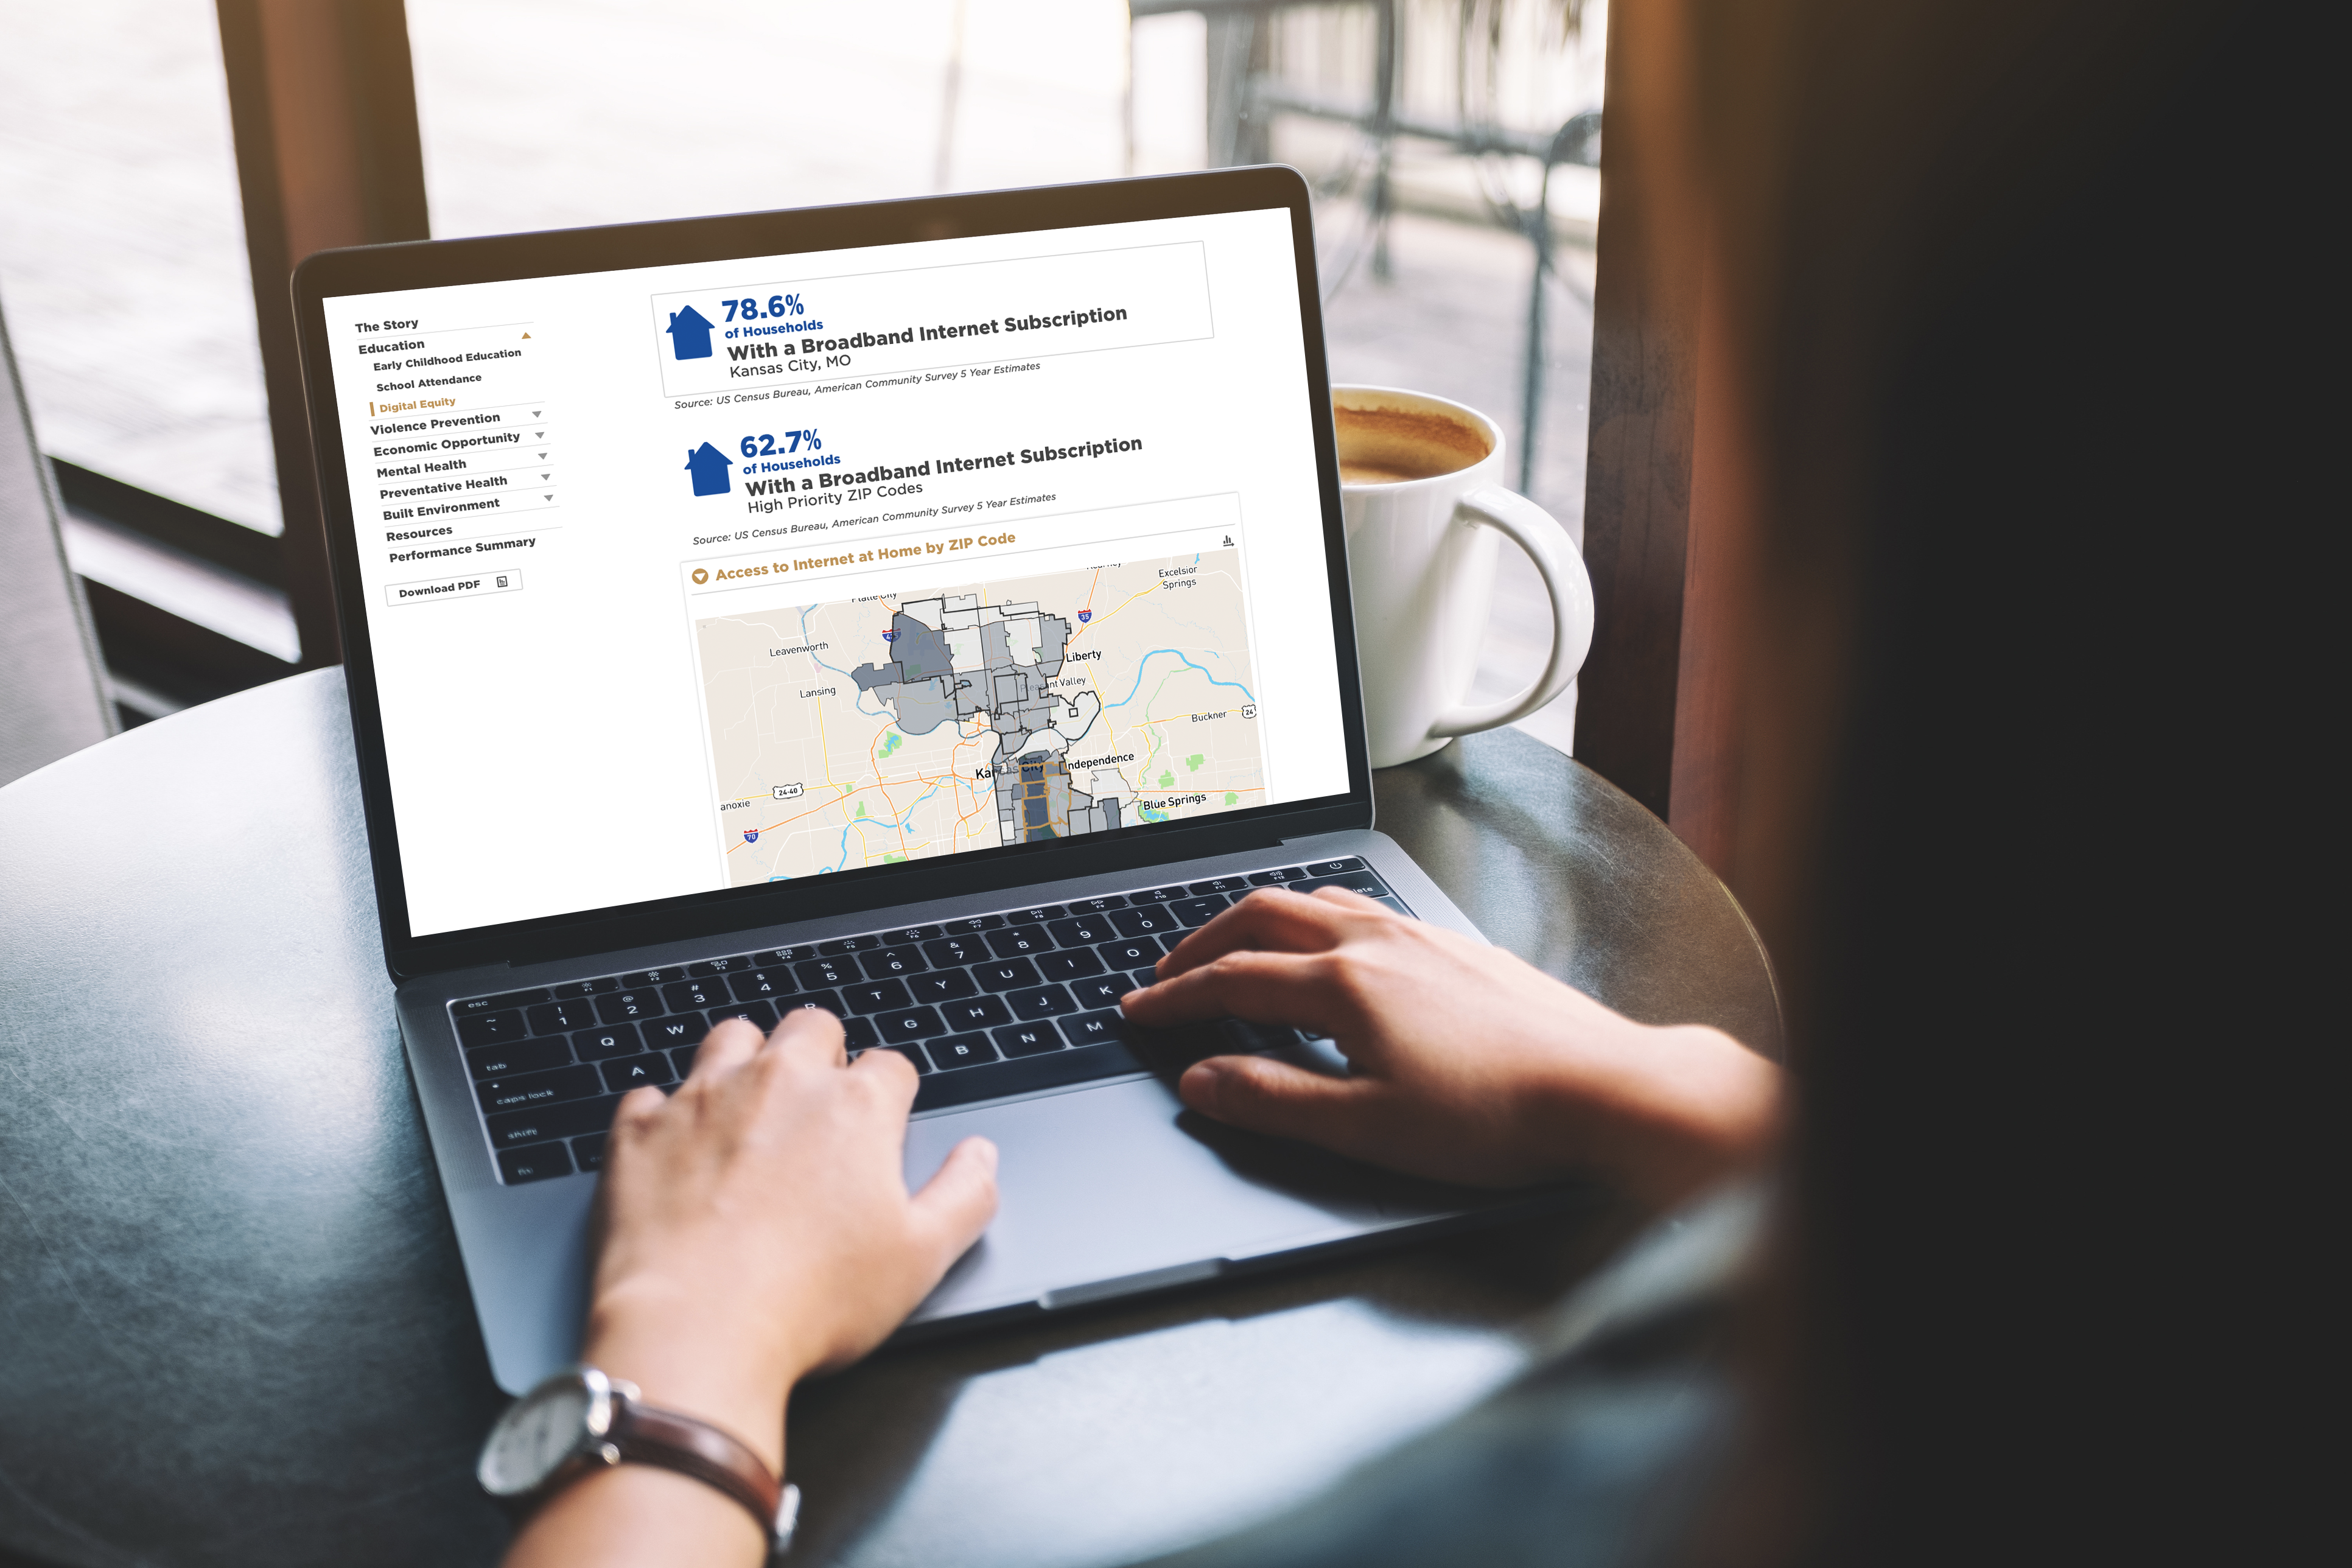
- CHAs begin by entering their patient’s ZIP Code into the platform to generate a report specific to that community. They can then further customize the report for their target audience: clinical providers or community-based organizations.
- After selecting a ZIP Code, CHAs select the social determinant of health that is most relevant to their patient’s needs:
- Housing
- Food Access & Insecurity
- Transportation
- Community & Context
- Education
- the80 will generate a custom report in under a minute. These reports are web-based, interactive, shareable, ADA accessible, and mobile optimized.
Your Community Health Assessment can do more. mySidewalk can help.

mySidewalk helps health systems and Health organizations transform their Community Health Assessments. We partner with you to create custom, dynamic dashboards that help you: get 10x the stakeholder engagement, improve data accuracy, cut costs, and save time. Learn more.
Share this
Data-Powered Advocacy: The Vitalyst Health Data Dashboard Story
2 SDoH Reports Every Public Health Director Needs
.png)
No Comments Yet
Let us know what you think